| Previous | Contents | Index |
This chapter presents an overview of the SDA Spinlock Tracing (SPL)
Utility and describes the SDA Spinlock Tracing commands.
8.1 Overview of the SDA Spinlock Tracing Utility
To synchronize access to data structures, the OpenVMS operating system uses a set of static and dynamic spinlocks, such as IOLOCK8 and SCHED. The operating system acquires a spinlock to synchronize data, and at the end of the critical code path the spinlock is then released. If a CPU attempts to acquire a spinlock while another CPU is holding it, the CPU attempting to acquire the spinlock has to spin, waiting until the spinlock is released. Any lost CPU cycles within such a spinwait loop are charged as MPsynch time.
By using the MONITOR utility, you can monitor the time in process modes, for example, with the command $ MONITOR MODES. A high rate of MP synchronization indicates contention for spinlocks. However, until the implementation of the Spinlock Tracing utility, there was no way to tell which spinlock was heavily used, and who was acquiring and releasing the contended spinlocks. The Spinlock Tracing utility allows a characterization of spinlock usage. It can also collect performance data for a given spinlock on a per-CPU basis.
This tracing ability is built into the system synchronization execlet, which contains the spinlock code, and can be enabled or disabled while the system is running. There is no need to reboot the system to load a separate debug image. The images that provide spinlock tracing functionality are as follows:
SYS$LOADABLE_IMAGES:SPL$DEBUG.EXE
SYS$SHARE:SPL$SDA.EXE
The SDA> prompt provides the command interface. From this command interface, you can load and unload the spinlock debug execlet using SPL LOAD and SPL UNLOAD, and start, stop and display spinlock trace data. This allows you to collect spinlock data for a given period of time without system interruption. Once information is collected, the trace buffer can be deallocated and the execlet can be unloaded to free up system resources. The spinlock trace buffer is allocated from S2 space and pages are taken from the free page list.
Should the system crash while spinlock tracing is enabled, the trace buffer is dumped into the system dump file, and it can later be analyzed using the spinlock trace utility. This is very useful in tracking down CPUSPINWAIT bugcheck problems.
Note that by enabling spinlock tracing, there is a performance impact.
The amount of the impact depends on the amount of spinlock usage.
8.2 How to Use the SDA Spinlock Tracing Utility
The following steps will enable you to collect spinlock statistics using the Spinlock Tracing Utility.
SDA> SPL LOAD |
SDA> SPL START TRACE |
SDA> SPL SHOW TRACE/SUMMARY |
SDA> SPL START COLLECT/SPINLOCK=SCHED |
SDA> SPL SHOW COLLECT |
SDA> SPL STOP COLLECT SDA> SPL STOP TRACE SDA> SPL UNLOAD |
The following example shows a command procedure that can be used for gathering spinlock statistics:
$ analyze/system spl load spl start trace/buffer=1000 wait 00:00:15 spl stop trace read/executive/nolog set output spl_trace.lis spl analyze spl show trace/summary spl start collect/spin=sched wait 00:00:05 spl show collect spl start collect/spin=iolock8 wait 00:00:05 spl show collect spl start collect/spin=lckmgr wait 00:00:05 spl show collect spl start collect/spin=mmg wait 00:00:05 spl show collect spl start collect/spin=timer wait 00:00:05 spl show collect spl start collect/spin=mailbox wait 00:00:05 spl show collect spl start collect/spin=perfmon wait 00:00:05 spl show collect spl stop collect spl unload exit $ exit |
A more comprehensive procedure is provided as SYS$EXAMPLES:SPL.COM.
8.4 SDA Spinlock Tracing Commands
The SPL commands are described on the following pages.
Invokes the Spinlock Tracing Utility.
When entered by itself with no command keyword, the SPL command lists the SPL command options.
SDA> SPL
|
Analyzes collected spinlock data and presents the most relevant data.
SPL ANALYZE [/[NO]CPU_STATISTICS |/[NO]PLATFORM | /[NO]HOLD_TIMES=n/[NO]WAIT_TIMES=n |/[NO]USAGE=(HOLD=n,SPIN=n,TOP_PCS=n)]
None.
/CPU_STATISTICS (default)
/NOCPU_STATISTICS
Displays per-CPU statistics./HOLD_TIMES=n
/NOHOLD_TIMES=n
Displays occurrences of spinlocks held longer than n microseconds. The default is 1000 microseconds./PLATFORM (default)
/NOPLATFORM
Displays system platform information./USAGE=(HOLD=n,SPIN=n, TOP_PCS=n)
Specifies thresholds for displaying information on a spinlock. If the percentage of time a spinlock is held exceeds the value of HOLD=n, where n is a value from 0 to 100, displays the information on the spinlock. The default is 10%. If the percentage of time a spinlock is spinning exceeds the value of SPIN=n, displays the information on the spinlock. The default is 10%. If either the HOLD or SPIN thresholds are exceeded, displays information on a spinlock. The TOP_PCS=n keyword displays the top n unique callers to lock a spinlock. The default is to display the top five unique callers.By specifying either /USAGE=(HOLD=0) or /USAGE=(SPIN=0), SPL displays information on all spinlock usage from the trace buffer.
/WAIT_TIMES=n
/NOWAIT_TIMES=n
Displays occurrences of spinlocks held longer than n microseconds. The default is 1000 microseconds.
The SPL ANALYZE command analyzes collected spinlock data and displays the most relevant data.The SPL ANALYZE command provides an overview of SPINLOCK usage on a system. Data are provided by CPU and by spinlock. When looking at a system with high MP_Synch time, this is a good command to start with. Stop spinlock tracing before using this command.
SDA> SPL ANALYZE/HOLD=50/WAIT=50/USAGE=HOLD=5

Spinlock Analysis (1)

 Platform
 ------------------------------------------------
 Node:  CLU21
 Hardware: AlphaServer ES45 Model 2
 Active CPUs: 4
 Memory:  16.00 GB
 CPU Frequency: 1.000 GHz

 Trace Buffer: 1280 pages (10.00 MB)
 Trace Time: 0.48 seconds
 Trace Start: 15-OCT 10:51:53.427386

CPU statistics (2)
                % Time in           % Time          % Time      All Spinlocks  All Spinlocks
CPU ID    Fork Dispatcher   Spinlocks Held        MP_Synch       Acquires/sec      Waits/sec
------    ---------------   --------------      ----------      -------------  -------------
    00                0.1             16.2             1.1            82210.4         1434.7
    01                0.1             15.8             1.2            79551.5         1548.3
    02                0.0             16.4             1.2            85690.9         1511.1
    03                1.7             17.7             1.1            86601.3         1451.2
------    ---------------   --------------      ----------      -------------  -------------
 Total                1.9             66.1             4.6           334054.1         5945.3

Spinlock Usage (3)
                                                                                                    Spin to
Spinlock      % Time Held Acquires/sec Average Hold % Time Spinning    Waits/sec  Average Spin   Hold Ratio
------------  ----------- ------------ ------------ --------------- ------------  ------------  -----------
FILSYS               15.6      33776.8         4609             2.6       2314.1         11379          0.2
LCKMGR                9.3      26198.6         3560             1.2       2208.8          5494          0.1
PCB$00000426          7.2      49420.4         1451             0.0         35.1          6342          0.0
PCB$00000428          7.1      49125.2         1437             0.0         14.5          7532          0.0


Spinlock    (4)                                         % Time   Acquires             Spinwaits    Average
        Caller's PC                                       Held       /sec    Average       /sec   Spinwait
        ----------------------------------------------  ------  ---------  ---------  ---------  ---------
FILSYS
        8022CA44  SEARCH_FCB_C+00604                      12.0     4021.3      29793      303.5      11985
        80222E10  SET_DIRINDX_C+00030                      0.5     4194.7       1163      247.7      11477
        8021B06C  START_REQUEST_C+0006C                    0.4     2438.0       1607      384.0      15838
        8021B208  FINISH_REQUEST_C+00058                   0.4     2440.1       1510      206.4      15862
        800FC508  IOC_STD$MAPVBLK_C+000C8                  0.3     2014.8       1713      402.5       9518
LCKMGR
        801DEB14  EXE$ENQ_C+00A44                          3.5    12984.7       2657      988.8       5727
        801E3B94  EXE$DEQ_C+00114                          3.0     5943.2       5109      538.8       4849
        801E03BC  LOCKING+023BC                            2.6     5941.2       4315      392.2       5682
        801E5C84  LCK$DEQLOCK_C+00F54                      0.3     1323.2       2091      289.0       5642
PCB$00000426
        801782F8  SCH$ASTDEL_C+00078                       1.9    15525.9       1256        0.0          0
        80179AC4  SCH$QAST_C+00094                         1.7     8907.6       1935        0.0          0
        8017A780  SCH$QUEUE_AST_CURRENT_C+00070            1.2     7859.0       1532        0.0          0
        80178FE0  SCH$ASTDEL_K_C+00090                     1.2     8895.3       1320        8.3       2346
        80179124  SCH$ASTDEL_K_C+001D4                     1.1     7780.5       1355        0.0          0
PCB$00000428
        801782F8  SCH$ASTDEL_C+00078                       2.0    15606.4       1308        0.0          0
        80179AC4  SCH$QAST_C+00094                         1.6     8810.6       1794        0.0          0
        80178FE0  SCH$ASTDEL_K_C+00090                     1.2     8810.6       1344        6.2       2589
        8017A780  SCH$QUEUE_AST_CURRENT_C+00070            1.2     7904.4       1492        0.0          0
        80179124  SCH$ASTDEL_K_C+001D4                     1.0     7728.9       1340        0.0          0
        8017A780  SCH$QUEUE_AST_CURRENT_C+00070            1.1     8655.8       1298        0.0          0
        80179124  SCH$ASTDEL_K_C+001D4                     1.1     8598.0       1225        0.0          0
        80178FE0  SCH$ASTDEL_K_C+00090                     1.1     9192.5       1144        2.1       2326

Long Spinlock Hold Times (> 50 microseconds) (5)

Timestamp              CPU Spinlock | Forklock   Calling PC | Forking PC                EPID      Hold (us)
---------------------- --- --------------------- -------------------------------------- --------  ---------
15-OCT 10:51:53.801244  00 81D6A200 81D6A200     8051B380 LAN$COMPLETE_VCRP_CSMACD_C+00 00000000         64
15-OCT 10:51:53.538665  00 818BBE00 POOL         8004B334 EXE$ALONPAGVAR_C+002F4        00000000         59
15-OCT 10:51:53.538331  03 81F75980 PCB$00000429 8017A808 SCH$QUEUE_AST_CURRENT_C+000F8 00000000         56
15-OCT 10:51:53.597448  03 818BBE00 POOL         8004B334 EXE$ALONPAGVAR_C+002F4        00000000         52
15-OCT 10:51:53.670228  03 818BBE00 POOL         8004B334 EXE$ALONPAGVAR_C+002F4        00000000         51

Long Spinlock Wait Times (> 50 microseconds) (6)

Timestamp              CPU Spinlock | Forklock   Calling PC | Forking PC                EPID      Wait (us)
---------------------- --- --------------------- -------------------------------------- --------  ---------
15-OCT 10:51:53.454082  03 818BCB00 FILSYS       800FC508 IOC_STD$MAPVBLK_C+000C8       00000000         79
15-OCT 10:51:53.661343  02 818BCB00 FILSYS       8021B208 FINISH_REQUEST_C+00058        00000000         76
15-OCT 10:51:53.661256  00 818BCB00 FILSYS       8021EDD0 F11BXQP+08DD0                 00000000         66
15-OCT 10:51:53.898618  00 818BCB00 FILSYS       8021B06C START_REQUEST_C+0006C         00000000         53
This example shows the output of the SPL ANALYZE command, which is divided into several sections:
Loads the SPL$DEBUG execlet. This must be done prior to starting spinlock tracing.
SPL LOAD
None.
None.
The SPL LOAD command loads the SPL$DEBUG execlet, which contains the tracing routines.
SDA> SPL LOAD
SPL$DEBUG load status = 00000001
|
Displays the collected spinlock data.
SPL SHOW COLLECT [/RATES|/TOTALS]
None.
/RATES
Reports activity as a rate per second and hold/spin time as a percentage of time. This is the default./TOTALS
Reports activity as a count and hold/spin time as cycles.
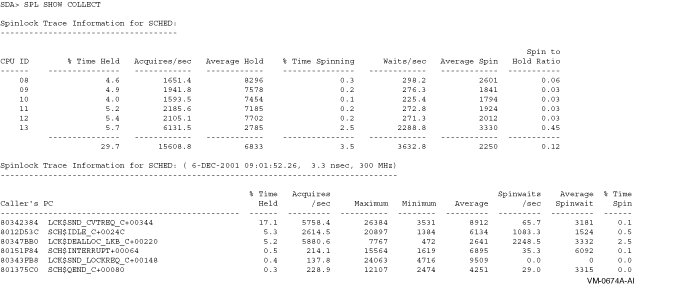
The SPL SHOW COLLECT command displays the collected spinlock data. It displays first a summary on a per-CPU basis, followed by the callers of the specific spinlock. This second list is sorted by the top consumers of the spinlock (in percent of time held). These displays show average spinlock hold and spinlock wait time in system cycles.

Displays spinlock tracing information.
SPL SHOW TRACE [ /[NO]ACQUIRE | /CPU=n
| /[NO]FORKLOCK=forklock | /[NO]FRKDSPTH
| /[NO]FRKEND | /RATES | /[NO]RELEASE
| /[NO]SPINLOCK=spinlock | /SUMMARY
| /TOP=n | /TOTALS | /[NO]WAIT ]
None.
/ACQUIRE
/NOACQUIRE
The /ACQUIRE qualifier displays any spinlock acquisitions.The /NOACQUIRE qualifier ignores any spinlock acquisitions.
/CPU=n
Specifies the display of information for a specific CPU only, for example, /CPU=5 or /CPU=PRIMARY. By default, all trace entries for all CPUs are displayed./FORKLOCK=forklock
/NOFORKLOCK
The /FORKLOCK=forklock qualifier specifies the display of a specific forklock, for example, /FORKLOCK=IOLOCK8 or /FORKLOCK=IPL8.The /NOFORKLOCK qualifier specifies that no forklock trace information be displayed. By default, all fork trace entries are decoded and displayed.
/FRKDSPTH
/NOFRKDSPTH
The /FRKDSPTH qualifier displays all invocations of fork routines within the fork dispatcher. This is the default.The /NOFRKDSPTH qualifier ignores all of the operations of the /FRKDSPTH qualifier.
/FRKEND
/NOFRKEND
The /FRKEND qualifier displays all returns from fork routines within the fork dispatcher. This is the default.The /NOFRKEND qualifier ignores all operations of the /FRKEND qualifier.
/RATES
Reports activity as a rate per second and hold/spin time as a percentage of time. This is the default./RELEASE
/NORELEASE
The /RELEASE qualifier displays any spinlock releases.The /NORELEASE qualifier ignores any spinlock releases.
/SPINLOCK=spinlock
/NOSPINLOCK
The /SPINLOCK=n qualifier specifies the display of a specific spinlock, for example, /SPINLOCK=LCKMGR or /SPINLOCK=SCHED./NOSPINLOCK specifies that no spinlock trace information be displayed. By default, all spinlock trace entries are decoded and displayed.
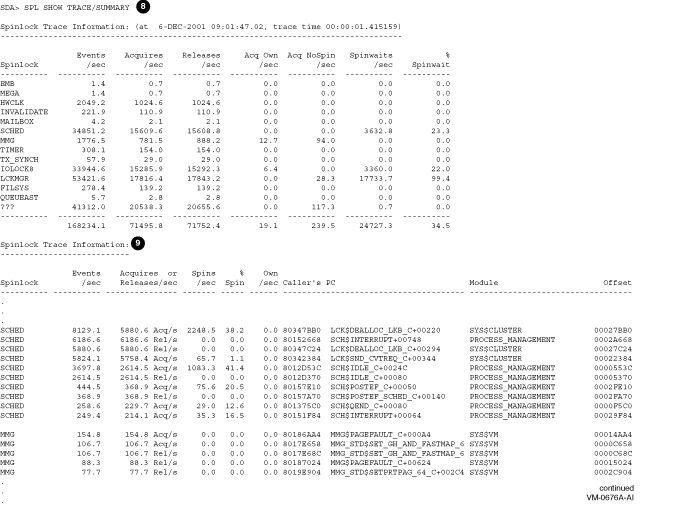
/SUMMARY
Steps through the entire trace buffer and displays a summary of all spinlock and forklock activity. It also displays the top ten callers./TOP=n
Displays a different number other than the top ten callers or fork PCs. By default, the top ten are displayed. This qualifier is useful only when you also specify /SUMMARY./TOTALS
Reports activity as a count and hold/spin time as cycles./WAIT
/NOWAIT
The /WAIT qualifier displays any spinwait operations.The /NOWAIT qualifier ignores any spinwait operations.
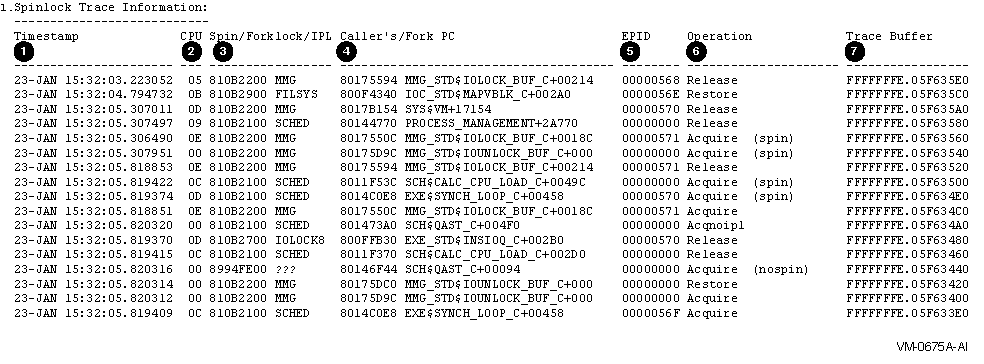
The SPL SHOW TRACE command displays spinlock tracing information. The latest acquired or released spinlock is displayed first, and then the trace buffer is stepped backwards in time.By default, all trace entries will be displayed, but you can use qualifiers to select only certain entries.
Since this is not a time critical activity and a table lookup has to be done anyway to translate the SPL address to a spinlock name, commands like /SPINLOCK=(SCHED,IOLOCK8) do work. /SUMMARY will step the entire trace buffer and display a summary of all spinlock activity, along with the top-ten callers' PCs. You can use /TOP=n to display a different number of the top ranked callers.
Examples

| Callout | Meaning |
|---|---|
| 1 | Shows timestamps that are collected as system cycle counters (SCC) and then displayed with an accuracy down to microseconds. Each CPU is incrementing its own SCC as soon as it is started, so there is some difference between different CPUs' system cycle counters. The standard system time is incremented only every 10 Msec and as such is not exact enough. Adjusting the SCC to the specific CPU's system time and translating it into an accurate timestamp will thus sometimes display times out of order for different CPUs. However, for the same CPU ID, the timestamps are accurate. |
| 2 | Shows the physical CPU ID of the CPU logging the trace entry. |
| 3 | Shows the address of the spinlock fork. If it is a static one, its name is displayed; otherwise, it is marked as ???. |
| 4 | Shows the caller's PC address that acquired or released the spinlock, or the fork PC if the trace entry is a forklock. Symbolization is attempted, so a READ/EXECUTIVE might help to display a routine name, instead of simply a module and offset. |
| 5 | Shows the EPID, which is the external PID of the process generating the trace entry. If an interrupt or fork was responsible for the entry, then a zero EPID is displayed. |
| 6 | Shows the trace operation. For a spinlock, which was acquired without going through a spinwait, there is a matching acquire/release pair of trace entries for the same CPU ID for a given spinlock. If a spinlock is held, it cannot be acquired immediately, so there is also a spinwait trace entry for this pair. The different variations of the acquire and release operations are distinguished, as are the same spinlocks if they are acquired recursively multiple times. |
| 7 | Shows the address of the trace buffer entry, in case there is a need to access the raw and undecoded trace data. |

| Callout | Meaning |
|---|---|
| 8 | Shows the summary information by stepping through the whole trace buffer, and displaying a single line of information for each spinlock. If the percent of spin wait is very high, then a spinlock is a candidate for high contention. |
| 9 | For each spinlock in the summary display, the top ten callers' PCs are displayed along with the number of spinlock acquisitions and releases, as well as spinwait counts and the number of multiple acquisitions of the same spinlock. |

| Callout | Meaning |
|---|---|
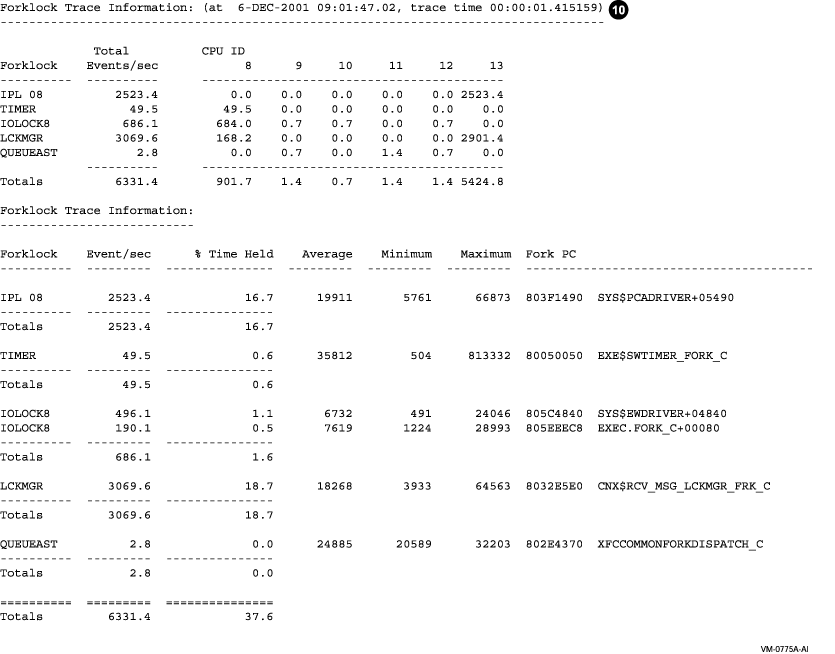
| 10 | The forklock summary displays the number of fork operations on a specific CPU for each forklock. For each forklock, the top ten fork PC addresses are displayed, along with the minimum, maximum and average duration of the fork operation in system cycles. The percent of time spent in a given fork routine is displayed along with the percent of time for the forklock. |
Starts to collect spinlock information a longer period of time than will fit into the trace buffer.
SPL START COLLECT [/SPINLOCK=spinlock|/ADDRESS=n]
None.
/ADDRESS=n
Specifies the tracing of a specific spinlock by address./SPINLOCK=spinlock
Specifies the tracing of a specific spinlock, for example, /SPINLOCK=LCKMGR or /SPINLOCK=SCHED.
The SPL START COLLECT command starts a collection of spinlock information for a longer period of time than will fit into the trace buffer. You need to enable spinlock tracing before a spinlock collection can be started. On a system with heavy activity, the trace buffer typically can only hold a relatively small time window of spinlock information. In order to collect spinlock information over a longer time period, a collection can be started. The collection tries to catch up with the running trace index and save the spinlock information into a balanced tree within the virtual address space of the process performing the spinlock collection. Either use the name of a static spinlock, or supply the address of a dynamic spinlock, for which information should be gathered.The trace entries are kept in the trace buffer, which is allocated from S2 space, hence there is no disruption, if tracing is started from within SDA and then the user exits from SDA. However, for the longer period data collection, the information is kept in process-specific memory, thus a user needs to stay within SDA; otherwise the data collection is automatically terminated by SDA's image rundown. You can collect data for two or more spinlocks simultaneously, by using a separate process for each collection.
| #1 |
|---|
SDA> SPL START COLLECT
Use /SPINLOCK=name or /ADDRESS=n to specify which spinlock info needs to be collected...
|
This example shows that you need to supply either a spinlock name of a static spinlock, or the address of a dynamic spinlock, if you want to collect information over a long period of time.
| #2 |
|---|
SDA> SPL START COLLECT/SPINLOCK=LCKMGR
|
This example shows the command line to start to collect information on the usage of the LCKMGR spinlock.
Enables spinlock tracing.
SPL START TRACE [ /[NO]ACQUIRE | /BUFFER=pages | /CPU=n
| /[NO]FORKLOCK=forklock | /[NO]FRKDSPTH
| /[NO]FRKEND | /[NO]RELEASE
| /[NO]SPINLOCK=spinlock | /[NO]WAIT ]
None.
/ACQUIRE
/NOACQUIRE
The /ACQUIRE qualifier traces any spinlock acquisitions. This is the default.The /NOACQUIRE qualifier ignores any spinlock acquisitions.
/BUFFER=pages
Specifies the size of the trace buffer (in page units). It defaults to 128 pages, which is equivalent to 1MB, if omitted./CPU=n
Specifies the tracing of a specific CPU only, for example, /CPU=5 or /CPU=PRIMARY. By default, all CPUs are traced./FORKLOCK=forklock
/NOFORKLOCK
The /FORKLOCK=forklock qualifier specifies the tracing of a specific forklock, for example, /FORKLOCK=IOLOCK8 or /FORKLOCK=IPL8.The /NOFORKLOCK qualifier disables forklock tracing and does not collect any forklock data. By default, all forks are traced.
/FRKDSPTH
/NOFRKDSPTH
The /FRKDSPTH qualifier traces all invocations of fork routines within the fork dispatcher. This is the default.The /NOFRKDSPTH qualifier ignores all of the /FRKDSPTH operations.
/FRKEND
/NOFRKEND
The /FRKEND qualifier traces all returns from fork routines within the fork dispatcher. This is the default.The /NOFRKEND qualifier ignores all of the operations of the /FRKEND qualifier.
/RELEASE
/NORELEASE
The /RELEASE qualifier traces any spinlock releases. This is the default.The /NORELEASE qualifier ignores any spinlock releases.
/SPINLOCK=spinlock
/NOSPINLOCK
The /SPINLOCK=spinlock qualifier specifies the tracing of a specific spinlock, for example, /SPINLOCK=LCKMGR or /SPINLOCK=SCHED.The /NOSPINLOCK qualifier disables spinlock tracing and does not collect any spinlock data. By default, all spinlocks are traced.
/WAIT
/NOWAIT
The /WAIT qualifier traces any spinwait operations. This is the default.The /NOWAIT qualifier ignores any spinwait operations.
The SPL START TRACE command enables spinlock and fork tracing. By default all spinlocks and forklocks are traced and a 128 page (1MByte) trace buffer is allocated and used as a ring buffer.
| #1 |
|---|
SDA> SPL START TRACE/BUFFER=1000
Tracing started... (Spinlock = 00000000, Forklock = 00000000)
|
This example shows how to enable a tracing for all spinlock and forklock operations into a 8 MByte trace buffer.
| #2 |
|---|
SDA> SPL START TRACE/CPU=PRIMARY/SPINLOCK=SCHED /NOFORKLOCK
Tracing started... (Spinlock = 810AF600, Forklock = 00000000)
|
This example shows how to trace only SCHED spinlock operations on the primary CPU.
| #3 |
|---|
SDA> SPL START TRACE /NOSPINLOCK /FORKLOCK=IPL8
Tracing started... (Spinlock = 00000000, Forklock = 863A4C00)
|
This example shows how to trace only fork operations to IPL8.
Stops the spinlock collection, but does not stop spinlock tracing.
SPL STOP COLLECT
None.
None.
The SPL STOP COLLECT command stops the data collection, but does not affect tracing. This allows the user to start another collection for a different spinlock during the same trace run.
SDA> SPL STOP COLLECT
|
Disables spinlock tracing, but it does not deallocate the trace buffer.
SPL STOP TRACE
None.
None.
The SPL STOP TRACE command stops tracing, but leaves the trace buffer allocated for further analysis.
SDA> SPL STOP TRACE
Tracing stopped...
|
Unloads the SPL$DEBUG execlet and performs cleanup. Tracing is automatically disabled and the trace buffer deallocated.
SPL UNLOAD
None.
None.
The SPL UNLOAD command disables the tracing or collection functionality with a delay to a state of quiescence. This ensures that all pending trace operations in progress have finished before the trace buffer is deallocated. Finally the SPL UNLOAD command unloads the SPL$DEBUG execlet.
SDA> SPL UNLOAD
SPL$DEBUG unload status = 00000001
|
| Previous | Next | Contents | Index |