 |
OpenVMS Alpha System Analysis Tools Manual
CLUE SYSTEM
Displays the contents of the shared logical name tables in the system.
Format
CLUE SYSTEM /LOGICAL
Parameters
None.
Qualifier
/LOGICAL
Displays all the shared logical names.
Description
The CLUE SYSTEM/LOGICAL command displays the contents of the shared
logical name tables in the system.
Example
|
SDA> CLUE SYSTEM/LOGICAL
Shareable Logical Names:
------------------------
   "XMICONBMSEARCHPATH" = "CDE$HOME_DEFAULTS:[ICONS]%B%M.BM"
   "MTHRTL_TV" = "MTHRTL_D53_TV"
   "SMGSHR_TV" = "SMGSHR"
   "DECW$DEFAULT_KEYBOARD_MAP" = "NORTH_AMERICAN_LK401AA"
   "CONVSHR_TV" = "CONVSHR"
   "XDPS$INCLUDE" = "SYS$SYSROOT:[XDPS$INCLUDE]"
   "DECW$SYSTEM_DEFAULTS" = "SYS$SYSROOT:[DECW$DEFAULTS.USER]"
   "SYS$PS_FONT_METRICS" = "SYS$SYSROOT:[SYSFONT.PS_FONT_METRICS.USER]"
   "SYS$TIMEZONE_NAME" = "???"
   "STARTUP$STARTUP_VMS" = "SYS$STARTUP:VMS$VMS.DAT"
   "PASMSG" = "PAS$MSG"
   "UCX$HOST" = "SYS$COMMON:[SYSEXE]UCX$HOST.DAT;1"
   "SYS$SYLOGIN" = "SYS$MANAGER:SYLOGIN"
   "DNS$SYSTEM" = "DNS$SYSTEM_TABLE"
   "IPC$ACP_ERRMBX" = "d.Ú."
   "CDE$DETACHED_LOGICALS" = "DECW$DISPLAY,LANG"
   "DECW$SERVER_SCREENS" = "GXA0"
   "DNS$_COTOAD_MBX" = "ä<â."
   "DNS$LOGICAL" = "DNS$SYSTEM"
   "OSIT$MAILBOX" = "äAë."
   "XNL$SHR_TV" = "XNL$SHR_TV_SUPPORT.EXE"
   "MOM$SYSTEM" = "SYS$SYSROOT:[MOM$SYSTEM]"
   "MOP$LOAD" = "SYS$SYSROOT:<MOM$SYSTEM>"
   .
   .
   .
|
CLUE VCC
Displays virtual I/O cache-related information.
Note
If extended file cache (XFC) is enabled, the CLUE VCC command is
disabled.
|
Format
CLUE VCC [/qualifier[,...]]
Parameters
None.
Qualifiers
/CACHE
Decodes and displays the cache lines that are used to correlate the
file virtual block numbers (VBNs) with the memory used for caching.
Note that the cache itself is not dumped in a selective dump. Use of
this qualifier with a selective dump produces the following message:
%CLUE-I-VCCNOCAC, Cache space not dumped because DUMPSTYLE is selective
|
/LIMBO
Walks through the limbo queue (LRU order) and displays information for
the cached file header control blocks (FCBs).
/STATISTIC
Displays statistical and performance information related to the virtual
I/O cache.
/VOLUME
Decodes and displays the cache volume control blocks (CVCB).
Examples
| #1 |
SDA>  CLUE VCC/STATISTIC
Virtual I/O Cache Statistics:
-----------------------------
Cache State       pak,on,img,data,enabled
Cache Flags       on,protocol_only
Cache Data Area   80855200
Total Size (pages)              400     Total Size (MBytes)               3.1 MB
Free Size (pages)                 0     Free Size (MBytes)                0.0 MB
Read I/O Count                34243     Read I/O Bypassing Cache       3149
Read Hit Count                15910     Read Hit Rate                    46.4%
Write I/O Count                4040     Write I/O Bypassing Cache       856
IOpost PID Action Rtns        40829     IOpost Physical I/O Count        28
IOpost Virtual I/O Count          0     IOpost Logical I/O Count          7
Read I/O past File HWM          124     Cache Id Mismatches              44
Count of Cache Block Hits       170     Files Retained                  100
Cache Line LRU    82B11220 82B11620     Oldest Cache Line Time     00001B6E
Limbo LRU Queue   80A97E3C 80A98B3C     Oldest Limbo Queue Time    00001B6F
Cache VCB Queue   8094DE80 809AA000     System Uptime (seconds)    00001BB0
|
| #2 |
SDA>  CLUE VCC/VOLUME
Virtual I/O Cache - Cache VCB Queue:
------------------------------------
CacheVCB RealVCB   LockID      IRP Queue     CID  LKSB Ocnt State
-------- -------- -------- ----------------- ---- ---- ---- ---------------
8094DE80 80A7E440 020007B2 8094DEBC 8094DEBC 0000 0001 0002 on
809F3FC0 809F97C0 0100022D 809F3FFC 809F3FFC 0000 0001 0002 on
809D0240 809F7A40 01000227 809D027C 809D027C 0000 0001 0002 on
80978B80 809F6C00 01000221 80978BBC 80978BBC 0000 0001 0002 on
809AA000 809A9780 01000005 809AA83C 809AA03C 0007 0001 0002 on
|
| #3 |
SDA>  CLUE VCC/LIMBO
Virtual I/O Cache - Limbo Queue:
--------------------------------
  CFCB     CVCB     FCB      CFCB   IOerrors   FID (hex)
-------- -------- -------- -Status- -------- --------------
80A97DC0 809AA000 80A45100 00000200 00000000 (076B,0001,00)
80A4E440 809AA000 809CD040 00000200 00000000 (0767,0001,00)
80A63640 809AA000 809FAE80 00000200 00000000 (0138,0001,00)
80AA2540 80978B80 80A48140 00000200 00000000 (0AA5,0014,00)
80A45600 809AA000 80A3AC00 00000200 00000000 (0C50,0001,00)
80A085C0 809AA000 809FA140 00000200 00000000 (0C51,0001,00)
80A69800 809AA000 809FBA00 00000200 00000000 (0C52,0001,00)
80951000 809AA000 80A3F140 00000200 00000000 (0C53,0001,00)
80A3E580 809AA000 80A11A40 00000200 00000000 (0C54,0001,00)
80A67F80 809AA000 80978F00 00000200 00000000 (0C55,0001,00)
809D30C0 809AA000 809F4CC0 00000200 00000000 (0C56,0001,00)
809D4B80 809AA000 8093E540 00000200 00000000 (0C57,0001,00)
[......]
80A81600 809AA000 8094B2C0 00000200 00000000 (0C5D,0001,00)
80AA3FC0 809AA000 80A2DEC0 00000200 00000000 (07EA,000A,00)
80A98AC0 809AA000 8093C640 00000200 00000000 (0C63,0001,00)
|
| #4 |
SDA>  CLUE VCC/CACHE

Virtual I/O Cache - Cache Lines:
--------------------------------
   CL       VA      CVCB     CFCB     FCB      CFCB   IOerrors   FID (hex)
-------- -------- -------- -------- -------- -Status- -------- ------------
82B11200 82880000 809D0240 809D7000 80A01100 00000200 00000000 (006E,0003,00)
82B15740 82AAA000 809AA000 80A07A00 80A24240 00000000 00000000 (0765,0001,00)
82B14EC0 82A66000 809AA000 80A45600 80A3AC00 00000200 00000000 (0C50,0001,00)
82B12640 82922000 809D0240 809D7000 80A01100 00000200 00000000 (006E,0003,00)
82B123C0 8290E000 809AA000 80A45600 80A3AC00 00000200 00000000 (0C50,0001,00)
82B13380 8298C000 809D0240 809D7000 80A01100 00000200 00000000 (006E,0003,00)
82B15A40 82AC2000 809AA000 80A45600 80A3AC00 00000200 00000000 (0C50,0001,00)
82B15F40 82AEA000 809D0240 809D7000 80A01100 00000200 00000000 (006E,0003,00)
82B12AC0 82946000 809D0240 809D7000 80A01100 00000200 00000000 (006E,0003,00)
82B12900 82938000 809D0240 809D7000 80A01100 00000200 00000000 (006E,0003,00)
82B10280 82804000 809AA000 80A45600 80A3AC00 00000200 00000000 (0C50,0001,00)
82B122C0 82906000 809AA000 80A1AC00 80A48000 00000000 00000000 (0164,0001,00)
82B14700 82A28000 809AA000 809FFEC0 809F8DC0 00000004 00000000 (07B8,0001,00)
82B11400 82890000 809AA000 80A113C0 80A11840 00000000 00000000 (00AF,0001,00)
[......]
82B11380 8288C000 809AA000 809DA0C0 809C99C0 00002000 00000000 (00AB,0001,00)
82B130C0 82976000 809AA000 809DA0C0 809C99C0 00002000 00000000 (00AB,0001,00)
82B11600 828A0000 809AA000 809DA0C0 809C99C0 00002000 00000000 (00AB,0001,00)
|
CLUE XQP
Displays XQP-related information.
Format
CLUE XQP [/qualifier[,...]]
Parameters
None.
Qualifiers
/ACTIVE [/FULL]
Displays all active XQP processes.
/AQB
Displays any current I/O request packets (IRPs) waiting at the
interlocked queue.
/BFRD=index
Displays the buffer descriptor (BFRD) referenced by the index
specified. The index is identical to the hash value.
/BFRL=index
Displays the buffer lock block descriptor (BFRL) referenced by the
index specified. The index is identical to the hash value.
/BUFFER=(n,m) [/FULL]
Displays the BFRDs for a given pool. Specify either 0, 1, 2 or 3, or a
combination of these in the parameter list.
/CACHE_HEADER
Displays the block buffer cache header.
/FCB=address [/FULL]
Displays all file header control blocks (FCBs) with a nonzero DIRINDX
for a given volume. If no address is specified, the current volume of
the current process is used.
The address specified can also be either a valid volume control block
(VCB), unit control block (UCB), or window control block (WCB) address.
/FILE=address
Decodes and displays file header (FCB), window (WCB), and cache
information for a given file. The file can be identified by either its
FCB or WCB address.
/GLOBAL
Displays the global XQP area for a given process.
/LBN_HASH=lbn
Calculates and displays the hash value for a given logical block number
(LBN).
/LIMBO
Searches through the limbo queue and displays FCB information from
available, but unused file headers.
/LOCK=lockbasis
Displays all file system serialization, arbitration, and cache locks
found for the specified lockbasis.
/THREAD=n
Displays the XQP thread area for a given process. The specified thread
number is checked for validity. If no thread number is specified, the
current thread is displayed. If no current thread, but only one single
thread is in use, then that thread is displayed. If more than one
thread exists or an invalid thread number is specified, then a list of
currently used threads is displayed.
/VALIDATE=(n,m)
Performs certain validation checks on the block buffer cache to detect
corruption. Specify 1, 2, 3, 4, or a combination of these in the
parameter list. If an inconsistency is found, a minimal error message
is displayed. If you add the /FULL qualifier, additional information is
displayed.
Description
The CLUE XQP command displays XQP information. XQP is part of the I/O
subsystem.
Examples
| #1 |
SDA>  CLUE XQP/CACHE_HEADER
Block Buffer Cache Header:
--------------------------
Cache_Header   8437DF90    BFRcnt         000005D2    FreeBFRL       843916A0
Bufbase        8439B400    BFRDbase       8437E080    BFRLbase       8438F7E0
Bufsize        000BA400    LBNhashtbl     84398390    BFRLhashtbl    84399BC8
Realsize       000D78A0    LBNhashcnt     0000060E    BFRLhashcnt    0000060E

Pool           #0          #1          #2          #3
Pool_LRU       8437E5C0    84385F40    84387E90    8438EEB0
               8437F400    84385D60    8438AC80    8438EE20
Pool_WAITQ     8437DFE0    8437DFE8    8437DFF0    8437DFF8
               8437DFE0    8437DFE8    8437DFF0    8437DFF8
Waitcnt        00000000    00000000    00000000    00000000
Poolavail      00000094    00000252    00000251    00000094
Poolcnt        00000095    00000254    00000254    00000095

AmbigQFL       00000000    Process_Hits   00000000    Cache_Serial   00000000
AmbigQBL       00000000    Valid_Hits     00000000    Cache_Stalls   00000000
Disk_Reads     00000000    Invalid_Hits   00000000    Buffer_Stalls  00000000
Disk_Writes    00000000    Misses         00000000
|
The SDA command CLUE XQP/CACHE_HEADER displays the block buffer cache
header.
| #2 |
SDA>  CLUE XQP/VALIDATE=(1,4)
Searching BFRD Array for possible Corruption...
Searching Lock Basis Hashtable for possible Corruption...
|
In this example, executing the CLUE XQP/VALIDATE=1,4 command indicated
that no corruption was detected in either the BFRD Array or the Lock
Basis Hashtable.
Chapter 6
SDA Spinlock Tracing Utility
This chapter presents an overview of the SDA Spinlock Tracing Utility
commands, and describes the SDA Spinlock Tracing commands.
6.1 Overview of the SDA Spinlock Tracing Utility
To synchronize access to data structures, the OpenVMS operating system
uses a set of static spinlocks, such as IOLOCK8 and SCHED. The
operating system acquires a spinlock to synchronize data, and at the
end of the critical code path the spinlock is then released. If a CPU
attempts to acquire a spinlock while another CPU is holding it, the CPU
attempting to acquire the spinlock has to spin, waiting until the
spinlock is released. Any lost CPU cycles within such a spinwait loop
are charged as MPsynch time.
By using the MONITOR utility, you can monitor the time in process
modes, for example, with the command $ MONITOR MODES. A high rate of MP
synchronization indicates contention for spinlocks. However, until the
implementation of the Spinlock Tracing utility, there was no way to
tell which spinlock was heavily used, and who was acquiring and
releasing the contended spinlocks. The Spinlock Tracing utility allows
a characterization of spinlock usage. It can also collect performance
data for a given spinlock on a per-CPU basis.
This tracing ability is built into the system synchronization execlet,
which contains the spinlock code, and can be enabled or disabled while
the system is running. There is no need to reboot the system to load a
separate debug image. The images that provide spinlock tracing
functionality are as follows:
SYS$LOADABLE_IMAGES:SPL$DEBUG.EXE
SYS$SHARE:SPL$SDA.EXE
The SDA> prompt provides the command interface. From this command
interface, you can load and unload the spinlock debug execlet using SPL
LOAD and SPL UNLOAD, and start, stop and display spinlock trace data.
This allows you to collect spinlock data for a given period of time
without system interruption. Once information is collected, the trace
buffer can be deallocated and the execlet can be unloaded to free up
system resources. The spinlock trace buffer is allocated from S2 space
and pages are taken from the freelist.
Should the system crash while spinlock tracing is enabled, the trace
buffer is dumped into the system dump file, and it can later be
analyzed using the spinlock trace utility. This is very useful in
tracking down CPUSPINWAIT bugcheck problems.
Note that by enabling spinlock tracing, there is a performance impact.
The amount of the impact depends on the amount of spinlock usage.
Note
The Spinlock Tracing utility is still under development. The command
format, displays, and suggested approach to spinlock analysis are all
subject to change.
|
6.2 How to Use the SDA Spinlock Tracing Utility
The following steps will enable you to collect spinlock statistics
using the Spinlock Tracing Utility.
- Load the Spinlock Tracing Utility execlet.
- Allocate a trace buffer and start tracing.
- Wait a few seconds to allow some tracing to be done, then find out
which spinlocks are incurring the most acquisitions and the most
spinwaits.
For example, you might see contention for the SCHED and IOLOCK8
spinlocks (a high acquisition count, with a significant proportion of
the acquisitions being forced to wait).
- Look to see if the spinlocks with a high proportion of spinwaits
caused a significant delay in the acquisition of the spinlock. You must
now collect more detailed statistics on a specific spinlock.
SDA> SPL START COLLECT/SPINLOCK=SCHED
|
This command accumulates additional data for the specified
spinlock. As long as tracing is not stopped, collection will continue
to accumulate spinlock-specific data from the trace buffer.
- Display the additional data collected for the specified spinlock.
This display includes the average hold time of the spinlock and the
average spinwait time while acquiring the spinlock.
- Repeat steps 4 and 5 for each spinlock that has contention. A START
COLLECT cancels the previous collection.
- Disable spinlock tracing when you have collected all the needed
spinlock statistics and release all the memory used by the Spinlock
Tracing utility with the following commands.
SDA> SPL STOP COLLECT
SDA> SPL STOP TRACE
SDA> SPL UNLOAD
|
6.3 Example Command Procedure for Collection of Spinlock Statistics
The following example shows a command procedure that can be used for
gathering spinlock statistics:
$ analyze/system
  spl load
  spl start trace/buffer=1000
  spawn wait 00:00:15
  spl stop trace
  read/executive/nolog
  set output spl_trace.lis
  spl show trace/summary
  spl start collect/spin=sched
  spawn wait 00:00:05
  spl show collect
  spl start collect/spin=iolock8
  spawn wait 00:00:05
  spl show collect
  spl start collect/spin=lckmgr
  spawn wait 00:00:05
  spl show collect
  spl start collect/spin=mmg
  spawn wait 00:00:05
  spl show collect
  spl start collect/spin=timer
  spawn wait 00:00:05
  spl show collect
  spl start collect/spin=mailbox
  spawn wait 00:00:05
  spl show collect
  spl start collect/spin=perfmon
  spawn wait 00:00:05
  spl show collect
  spl stop collect
  spl unload
  exit
$ exit
|
A more comprehensive procedure is provided as SYS$EXAMPLES:SPL.COM.
6.4 Listing of SDA Spinlock Tracing Commands
The following is a list of the spinlock tracing commands:
SPL LOAD
SPL SHOW COLLECT
SPL SHOW TRACE
SPL START COLLECT
SPL START TRACE
SPL STOP COLLECT
SPL STOP TRACE
SPL UNLOAD
SPL LOAD
Loads the SPL$DEBUG execlet. This must be done prior to starting
spinlock tracing.
Format
SPL LOAD
Parameters
None.
Qualifiers
None.
Description
The SPL LOAD command loads the SPL$DEBUG execlet, which contains the
tracing routines.
Example
|
SDA> SPL LOAD
SPL$DEBUG load status = 00000001
|
SPL SHOW COLLECT
Displays the collected spinlock data.
Format
SPL SHOW COLLECT
Parameters
None.
Qualifiers
None.
Description
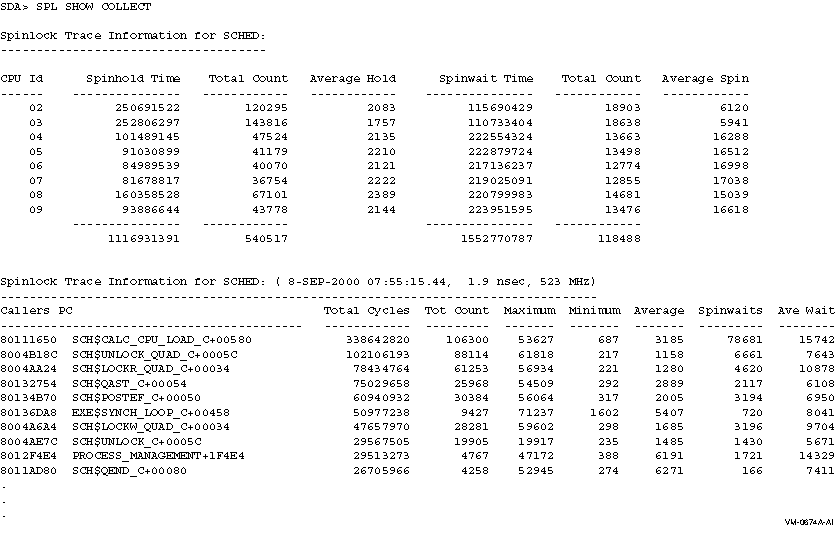
The SPL SHOW COLLECT command displays the collected spinlock data. It
displays first a summary on a per-CPU basis, followed by the callers of
the specific spinlock. This second list is sorted by the top consumers
of the spinlock (in system cycles). These displays show average
spinlock hold and spinlock wait time in system cycles.
Example

SPL SHOW TRACE
Displays spinlock tracing information.
Format
SPL SHOW TRACE
[/[NO]SPINLOCK=spinlock|/[NO]FORKLOCK=forklock
|/[NO]ACQUIRE|/[NO]RELEASE|/[NO]WAIT
|/[NO]FRKDSPTH|/[NO]FRKEND
|/SUMMARY|/CPU=n|/TOP=n]
Parameters
None.
Qualifiers
/SPINLOCK=spinlock
/NOSPINLOCK
The /SPINLOCK=n qualifier specifies the display of a specific
spinlock, for example, /SPINLOCK=LCKMGR or /SPINLOCK=SCHED.
The /NOSPINLOCK qualifier specifies that no spinlock trace information
be displayed. If omitted, all spinlock trace entries are decoded and
displayed.
/FORKLOCK=forklock
/NOFORKLOCK
The /FORKLOCK=forklock qualifier specifies the display of a
specific forklock, for example, /FORKLOCK=IOLOCK8 or /FORKLOCK=IPL8.
The /NOFORKLOCK qualifier specifies that no forklock trace information
be displayed. If omitted, all fork trace entries are decoded and
displayed.
/ACQUIRE
/NOACQUIRE
The /ACQUIRE qualifier displays any spinlock acquisitions.
The /NOACQUIRE qualifier ignores any spinlock acquisitions.
/RELEASE
/NORELEASE
The /RELEASE qualifier displays any spinlock releases.
The /NORELEASE qualifier ignores any spinlock releases.
/WAIT
/NOWAIT
The /WAIT qualifier displays any spinwait operations.
The /NOWAIT qualifier ignores any spinwait operations.
/FRKDSPTH
/NOFRKDSPTH
The /FRKDSPTH qualifier displays all invocations of fork routines
within the fork dispatcher. This is the default.
The /NOFRKDSPTH qualifier ignores all of the operations of the
/FRKDSPTH qualifier.
/FRKEND
/NOFRKEND
The /FRKEND qualifier displays all returns from fork routines within
the fork dispatcher. This is the default.
The /NOFRKEND qualifier ignores all operations of the /FRKEND qualifier.
/CPU=n
Specifies the display of information for a specific CPU only, for
example, /CPU=5 or /CPU=PRIMARY. By default, all trace entries for all
CPUs are displayed.
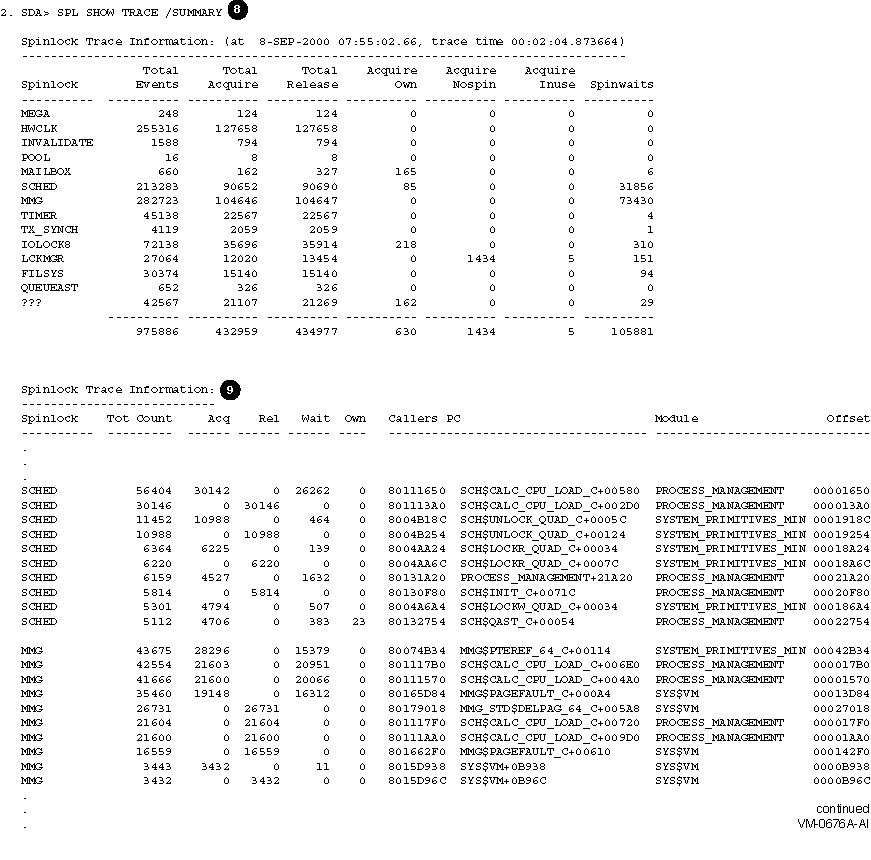
/SUMMARY
Steps through the entire trace buffer and displays a summary of all
spinlock and forklock activity. It also displays the top ten callers.
/TOP=n
Displays a different number other than the top ten callers or fork PCs.
By default, the top ten are displayed. This qualifier is only useful
when you also specify the /SUMMARY qualifier.
Description
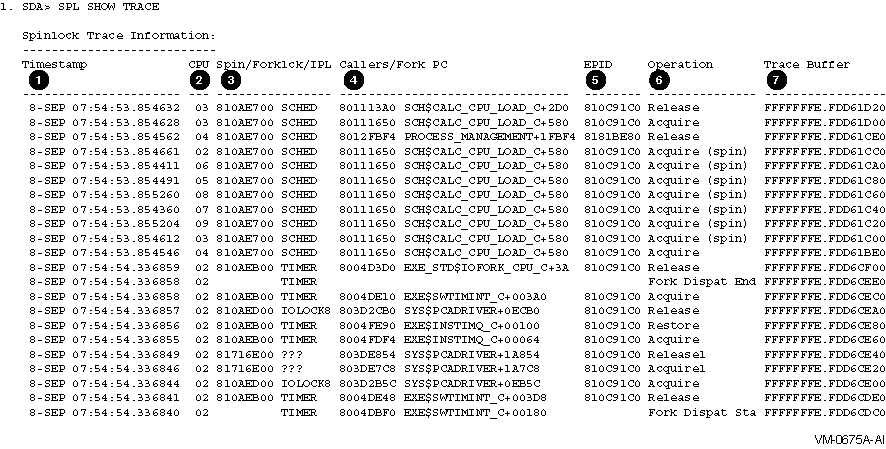
The SPL SHOW TRACE command displays spinlock tracing information. The
latest acquired or released spinlock is displayed first, and then the
trace buffer is stepped backwards in time.
By default, all trace entries will be displayed, but you can use
qualifiers to select only certain entries.
Since this is not a time critical activity and a table lookup has to be
done anyway to translate the SPL address to a spinlock name, commands
like /SPINLOCK=(SCHED,IOLOCK8) do work. /SUMMARY will step the entire
trace buffer and display a summary of all spinlock activity, along with
the top-ten callers' PCs. You can use /TOP=n to display a different
number of the top ranked callers.

| Callout |
Meaning |
|
1
|
Shows timestamps that are collected as system cycle counters (SCC) and
then displayed with an accuracy down to microseconds. Each CPU is
incrementing its own SCC as soon as it is started, so there is some
difference between different CPUs' system cycle counters. The standard
system time is incremented only every 10 Msec and as such is not exact
enough. Adjusting the SCC to the specific CPU's system time and
translating it into an accurate timestamp will thus sometimes display
times out of order for different CPUs. However, for the same CPU ID,
the timestamps are accurate.
|
|
2
|
Shows the physical CPU ID of the CPU logging the trace entry.
|
|
3
|
Shows the address of the spinlock fork. If it is a static one, its name
is displayed; otherwise, it is marked as ??????.
|
|
4
|
Shows the caller's PC address that acquired or released the spinlock,
or the fork PC if the trace entry is a forklock. Symbolization is
attempted, so a READ/EXECUTIVE might help to display a routine name,
instead of simply a module and offset.
|
|
5
|
Shows the EPID, which is the external PID of the process generating the
trace entry. If an interrupt or fork was responsible for the entry,
then a zero EPID is displayed.
|
|
6
|
Shows the trace operation. For a spinlock, which was acquired without
going through a spinwait, there is a matching acquire/release pair of
trace entries for the same CPU ID for a given spinlock. If a spinlock
is held, it cannot be acquired immediately, so there is also a spinwait
trace entry for this pair. The different variations of the acquire and
release operations are distinguished, as are the same spinlocks if they
are acquired recursively multiple times.
|
|
7
|
Shows the address of the trace buffer entry, in case there is a need to
access the raw and undecoded trace data.
|

| Callout |
Meaning |
|
8
|
Shows the summary information by stepping through the whole trace
buffer, and displaying a single line of information for each spinlock.
If the number of spinwaits compared to the number of acquisitions is
very high, then a spinlock is a candidate for high contention.
|
|
9
|
For each spinlock in the summary display, the top ten callers' PCs are
displayed along with the number of spinlock acquisitions and releases,
as well as spinwait counts and the number of multiple acquisitions of
the same spinlock.
|

| Callout |
Meaning |
|
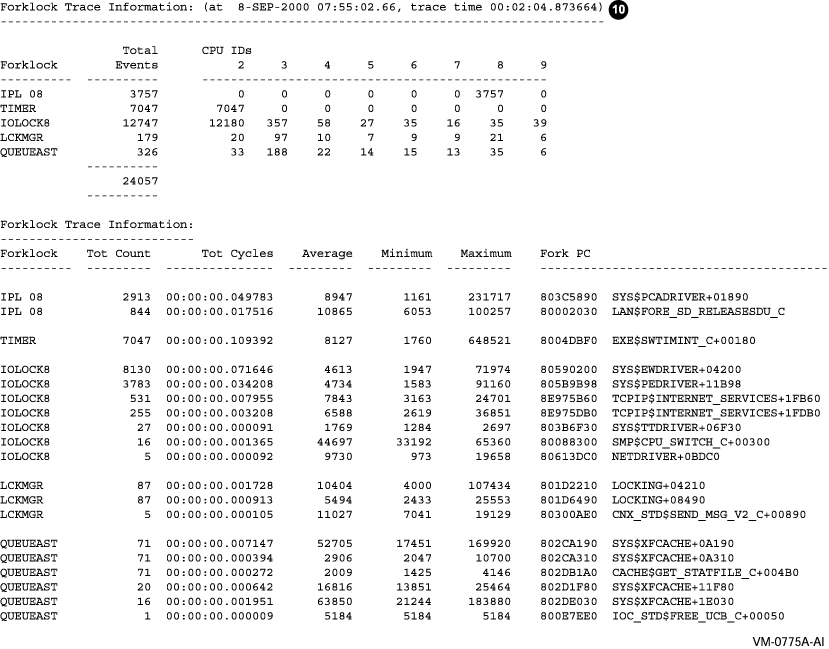
10
|
The forklock summary displays the number of fork operations on a
specific CPU for each forklock. For each forklock, the top ten fork PC
addresses are displayed, along with the minimum, maximum and average
duration of the fork operation in system cycles. The total amount of
time spent in a given fork routine is displayed in a time format
accurate to microseconds.
|
|
