Previous | Contents | Index |
This section discusses how the operating system handles internal errors, and suggests procedures that can help you determine the causes of these errors. It illustrates, through detailed analysis of a sample system failure, how SDA helps you find the causes of operating system problems.
For a complete description of the commands discussed in the sections
that follow, refer to Chapter 4 and Chapter 5 of this document,
where all the SDA and CLUE commands are presented in alphabetical order.
2.7.1 Procedure for Analyzing System Failures
When the operating system detects an internal error so severe that normal operation cannot continue, it signals a condition known as a fatal bugcheck and shuts itself down. A specific bugcheck code describes each fatal bugcheck.
To resolve the problem, you must find the reason for the bugcheck. Many failures are caused by errors in user-written device drivers or other privileged code not supplied by HP. To identify and correct these errors, you need a listing of the code in question.
Occasionally, a system failure is the result of a hardware failure or an error in code supplied by HP. A hardware failure requires the attention of HP Services. To diagnose an error in code supplied by HP, you need listings of that code, which are available from HP.
Start the search for the error by analyzing the CLUE list file that was created by default when the system failed. This file contains an overview of the system failure, which can assist you in finding the line of code that signaled the bugcheck. CLUE CRASH displays the content of the program counter (PC) in the list file. The content of the PC is the address of the next instruction after the instruction that signaled the bugcheck.
However, some bugchecks are caused by unexpected exceptions. In such cases, the address of the instruction that caused the exception is more informative than the address of the instruction that signaled the bugcheck.
The address of the instruction that caused the exception is located on the stack. You can obtain this address either by using the SHOW STACK command to display the contents of the stack or by using the SHOW CRASH or CLUE CRASH command to display the system state at time of exception. See Section 2.7.2 for information on how to proceed for several types of bugchecks.
Once you have found the address of the instruction that caused the bugcheck or exception, find the module in which the failing instruction resides. Use the MAP command to determine whether the instruction is part of a device driver or another executive image. Alternatively, the SHOW EXECUTIVE command shows the location and size of each of the images that make up the OpenVMS executive.
If the instruction that caused the bugcheck is not part of a driver or executive image, examine the linker's map of the module or modules you are debugging to determine whether the instruction that caused the bugcheck is in your program.
To determine the general cause of the system failure, examine the code
that signaled the bugcheck or the instruction that caused the exception.
2.7.2 Fatal Bugcheck Conditions
There are many possible conditions that can cause OpenVMS to issue a bugcheck. Normally, these occasions are rare. When they do occur, they are often fatal exceptions or illegal page faults occurring within privileged code. This section describes the symptoms of several common bugchecks. A discussion of other exceptions and condition handling in general appears in the HP OpenVMS Programming Concepts Manual.
An exception is fatal when it occurs while either of the following conditions exists:
When the system fails, the operating system reports the approximate cause of the system failure on the console terminal. SDA displays a similar message when you issue a SHOW CRASH command. For instance, for a fatal exception, SDA can display one of these messages:
FATALEXCPT, Fatal executive or kernel mode exception INVEXCEPTN, Exception while above ASTDEL SSRVEXCEPT, Unexpected system service exception UNXSIGNAL, Unexpected signal name in ACP |
When a FATALEXCPT, INVEXCEPTN, SSRVEXCEPT, or UNXSIGNAL bugcheck occurs, two argument lists, known as the mechanism and signal arrays, are placed on the stack.
Section 2.7.2.1 to Section 2.7.2.6 describe these arrays and related data structures, and Section 2.7.2.7 shows example output from SDA for an SSRVEXCEPT bugcheck.
A page fault is illegal when it occurs while the interrupt priority level (IPL) is greater than 2 (IPL$_ASTDEL). When OpenVMS fails because of an illegal page fault, it displays the following message on the console terminal:
PGFIPLHI, Page fault with IPL too high |
Section 2.7.2.8, Illegal Page Faults describes the stack contents when an illegal page fault
occurs.
2.7.2.1 Alpha Mechanism Array
Figure 2-1 illustrates the Alpha mechanism array, which is made up entirely of quadwords. The first quadword of this array indicates the number of quadwords in this array; this value is always 2C16. These quadwords are used by the procedures that search for a condition handler and report exceptions.
Figure 2-1 Alpha Mechanism Array
Symbolic offsets into the mechanism array are defined by using the SDA SHOW STACK command to identify the elements of the mechanism array on the stack using the symbols in Table 2-9.
Offset | Meaning |
---|---|
CHF$IS_MCH_ARGS | Number of quadwords that follow. In a mechanism array, this value is always 2C 16. |
CHF$IS_MCH_FLAGS | Flag bits for related argument mechanism information. |
CHF$PH_MCH_FRAME | Address of the FP (frame pointer) of the establisher's call frame. |
CHF$IS_MCH_DEPTH | Depth of the OpenVMS search for a condition handler. |
CHF$PH_MCH_DADDR | Address of the handler data quadword, if the exception handler data field is present. |
CHF$PH_MCH_ESF_ADDR | Address of the exception stack frame (see Figure 2-5). |
CHF$PH_MCH_SIG_ADDR | Address of the signal array (see Figure 2-3). |
CHF$IH_MCH_SAVRnn | Contents of the saved integer registers at the time of the exception. The following registers are saved: R0, R1, and R16 to R28 inclusive. |
CHF$FH_MCH_SAVFnn | If the process was using floating point, contents of the saved floating-point registers at the time of the exception. The following registers are saved: F0, F1, and F10 to F30 inclusive. |
CHF$PH_MCH_SIG64_ADDR | Address of the 64-bit signal array (see Figure 2-4). |
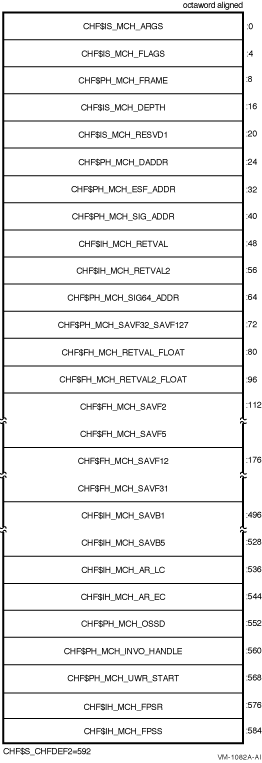
Figure 2-2 illustrates the Integrity server mechanism array, which is made up entirely of quadwords. The first quadword of this array indicates the number of quadwords in the array. This value is either 4916, if floating point registers F32 to F127 have not been saved, or 10916, if the floating point registers have been saved. These quadwords are used by the procedures that search for a condition handler and report exceptions.
Figure 2-2 Integrity server Mechanism Array
Symbolic offsets into the mechanism array are defined by using the SDA SHOW STACK command to identify the elements of the mechanism array on the stack using the symbols in Table 2-10.
Field Name | Contents |
---|---|
CHF$IS_MCH_ARGS | Count of quadwords in this array starting from the next quadword, CHF$PH_MCH_FRAME (not counting the first quadword that contains this longword). This value is 73 if CHF$V_FPREGS2_VALID is clear, and 265 if CHF$V_FPREGS2_VALID is set. |
CHF$IS_MCH_FLAGS | Flag bits for related argument-mechanism information. |
CHF$PH_MCH_FRAME | Contains the Previous Stack Pointer, PSP, (the value of the SP at procedure entry) for the procedure context of the establisher. |
CHF$IS_MCH_DEPTH | Positive count of the number of procedure activation stack frames between the frame in which the exception occurred and the frame depth that established the handler being called. |
CHF$PH_MCH_DADDR | Address of the handler data quadword (start of the Language Specific Data area, LSDA), if the exception handler data field is present in the unwind information block (as indicated by OSSD$V_HANDLER_DATA_VALID); otherwise, contains 0. |
CHF$PH_MCH_ESF_ADDR | Address of the exception stack frame. |
CHF$PH_MCH_SIG_ADDR | Address of the 32-bit form of signal array. This array is a 32-bit wide (longword) array. This is the same array that is passed to a handler as the signal argument vector. |
CHF$IH_MCH_RETVAL | Contains a copy of R8 at the time of the exception. |
CHF$IH_MCH_RETVAL2 | Contains a copy of R9 at the time of the exception. |
CHF$PH_MCH_SIG64_ADDR | Address of the 64-bit form of signal array. This array is a 64-bit wide (quadword) array. |
CHF$FH_MCH_SAVF32_SAVF127 | Address of the extension to the mechanism array that contains copies of F32 to F127 at the time of the exception. |
CHF$FH_MCH_RETVAL_FLOAT | Contains a copy of F8 at the time of the exception. |
CHF$FH_MCH_RETVAL2_FLOAT | Contains a copy of F9 at the time of the exception. |
CHF$FH_MCH_SAVFnn | Contain copies of floating-point registers F2 to F5 and F12 to F31. Registers F6, F7 and F10, F11 are implicitly saved in the exception frame. |
CHF$IH_MCH_SAVBnn | Contain copies of branch registers B1 to B5 at the time of the exception. |
CHF$IH_MCH_AR_LC | Contains a copy of the Loop Count Register (AR65) at the time of the exception. |
CHF$IH_MCH_AR_EC | Contains a copy of the Epilog Count Register (AR66) at the time of the exception. |
CHF$PH_MCH_OSSD | Address of the operating-system specific data area. |
CHF$PH_MCH_INVO_HANDLE | Contains the invocation handle of the procedure context of the establisher. |
CHF$PH_MCH_UWR_START | Address of the unwind region. |
CHF$IH_MCH_FPSR | Contains a copy of the hardware floating-point status register (AR.FPSR) at the time of the exception. |
CHF$IH_MCH_FPSS | Contains a copy of the software floating-point status register (which supplements CHF$IH_MCH_FPSR) at the time of the exception. |
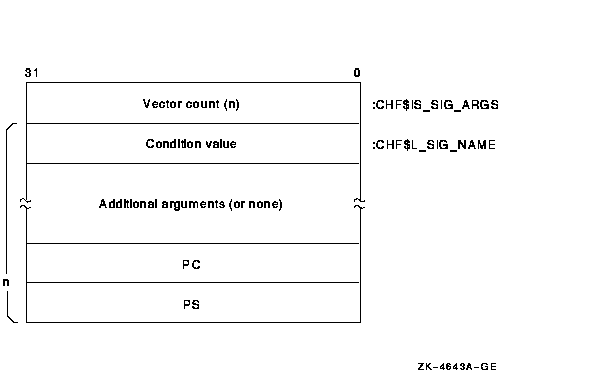
The signal array appears somewhat further down the stack. This array comprises all longwords so that the structure is VAX compatible. A signal array describes the exception that occurred. It contains an argument count, the exception code, zero or more exception parameters, the PC, and the PS. Therefore, the size of a signal array can vary from exception to exception. Although there are several possible exception conditions, access violations are most common. Figure 2-3 shows the signal array for an access violation.
Figure 2-3 Signal Array
For access violations, the signal array is set up as follows:
Value | Meaning |
---|---|
Vector list length | Number of longwords that follow. For access violations, this value is always 5. |
Condition value | Exception code. The value 0C 16 represents an access violation. You can identify the exception code by using the SDA command EVALUATE/CONDITION_VALUE or SHOW CRASH. |
Additional arguments |
These can include a reason mask and a virtual address.
In the longword mask if bit 0 of the longword is set, the failing instruction (at the PC saved below) caused a length violation. If bit 1 is set, it referred to a location whose page table entry is in a "no access" page. Bit 2 indicates the type of access used by the failing instruction: it is set for write and modify operations and clear for read operations. The virtual address represents the low-order 32 bits of the virtual address that the failing instruction tried to reference. |
PC | PC whose execution resulted in the exception. |
PS | PS at the time of the exception. |
2.7.2.4 64-Bit Signal Array
The 64-bit signal array also appears further down the
stack. This array comprises all quadwords and is not VAX compatible. It
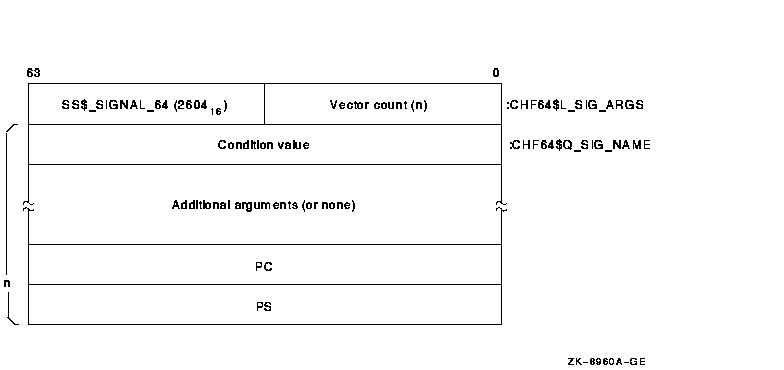
contains the same data as the signal array, and Figure 2-4 shows the
64-bit signal array for an access violation. The SDA SHOW STACK command
uses the CHF64$ symbols listed in the figure to identify the 64-bit
signal array on the stack.
Figure 2-4 64-Bit Signal Array
For access violations, the 64-bit signal array is set up as follows:
Value | Meaning |
---|---|
Vector list length | Number of quadwords that follow. For access violations, this value is always 5. |
Condition value | Exception code. The value 0C 16 represents an access violation. You can identify the exception code by using the SDA command EVALUATE/CONDITION_VALUE or SHOW CRASH. |
Additional arguments |
These can include a reason mask and a virtual address.
In the quadword mask if bit 0 of the quadword is set, the failing instruction (at the PC saved below) caused a length violation. If bit 1 is set, it referred to a location whose page table entry is in a "no access" page. Bit 2 indicates the type of access used by the failing instruction: it is set for write and modify operations and clear for read operations. |
PC | PC whose execution resulted in the exception. |
PS | PS at the time of the exception. |
2.7.2.5 Alpha Exception Stack Frame
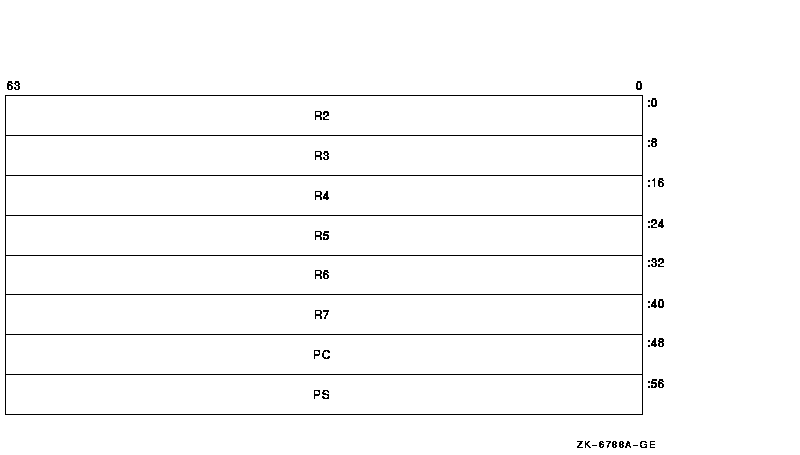
Figure 2-5 illustrates the Alpha exception stack frame, which
comprises all quadwords.
Figure 2-5 Alpha Exception Stack Frame
The values contained in the exception stack frame are defined as follows:
Value | Contents |
---|---|
INTSTK$Q_R2 | Contents of R2 at the time of the exception |
INTSTK$Q_R3 | Contents of R3 at the time of the exception |
INTSTK$Q_R4 | Contents of R4 at the time of the exception |
INTSTK$Q_R5 | Contents of R5 at the time of the exception |
INTSTK$Q_R6 | Contents of R6 at the time of the exception |
INTSTK$Q_R7 | Contents of R7 at the time of the exception |
INTSTK$Q_PC | PC whose execution resulted in the exception |
INTSTK$Q_PS | PS at the time of the exception (except high-order bits) |
The SDA SHOW STACK command identifies the elements of the exception
stack frame on the stack using these symbols.
2.7.2.6 Integrity server Exception Stack Frame
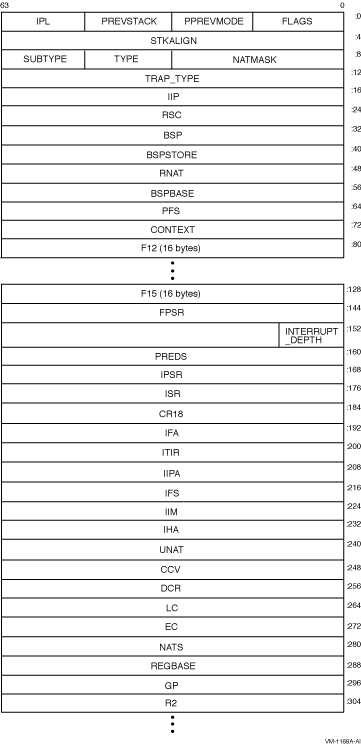
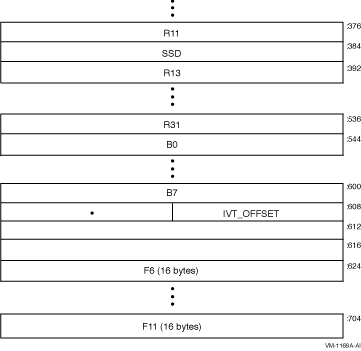
Figure 2-6 and Figure 2-7 illustrate the Integrity servers exception stack frame.
Figure 2-6 Integrity servers Exception Stack Frame
Figure 2-7 Integrity servers Exception Stack Frame (cont.)
The values contained in the exception stack frame are defined in Table 2-12.
Field | Use |
---|---|
INTSTK$B_FLAGS | Indicates if certain registers have been saved. |
INTSTK$B_PPREVMODE | Save interrupted context's PREVMODE. |
INTSTK$B_PREVSTACK | Indicates which mode of stack (register and memory) we return to. |
INTSTK$B_IPL | SWIS IPL state |
INTSTK$L_STKALIGN | How much allocated on this stack for exception frame. |
INTSTK$W_NATMASK | Mask of bits 3-9 of the exception frame address. |
INTSTK$B_TYPE | Standard VMS structure type. |
INTSTK$B_SUBTYPE | Standard VMS structure subtype. |
INTSTK$L_TRAP_TYPE | Trap type. |
INTSTK$Q_IIP | Interruption Instruction Pointer (CR19). |
INTSTK$Q_RSC | Register Stack Control register. |
INTSTK$Q_BSP | Backing store pointer. |
INTSTK$Q_BSPSTORE | User BSP store pointer for next spill. |
INTSTK$Q_RNAT | RNAT register. |
INTSTK$Q_BSPBASE | Base of backing store for the inner mode. |
INTSTK$Q_PFS | Previous function state. |
INTSTK$Q_CONTEXT | Bookkeeping data for exception processing. |
INTSTK$Q_AST_F12 through INTSTK$Q_AST_F15 | F12 to F15 - temporary FP registers; sometimes saved by AST. |
INTSTK$Q_FPSR | Floating point status register. |
INTSTK$B_INTERRUPT_DEPTH | Interrupt depth. |
INTSTK$Q_PREDS | Predication registers. |
INTSTK$Q_IPSR | Interruption Processor Status (CR16). |
INTSTK$Q_ISR | Interruption Status Register (CR17). |
INTSTK$Q_CR18 | Reserved control register. |
INTSTK$Q_IFA | Interruption Fault Address (CR20). |
INTSTK$Q_ITIR | Interruption TLB Insertion Register (CR21). |
INTSTK$Q_IIPA | Interruption immediate register (CR22). |
INTSTK$Q_IFS | Interruption Function State (CR23). |
INTSTK$Q_IIM | Interruption immediate (CR24). |
INTSTK$Q_IHA | Interruption Hash Address (CR25). |
INTSTK$Q_UNAT | User NAT collection register. |
INTSTK$Q_CCV | CCV register. |
INTSTK$Q_DCR | Default control register. |
INTSTK$Q_LC | Loop counter. |
INTSTK$Q_EC | Epilogue counter. |
INTSTK$Q_NATS | NATs for registers saved in this structure. |
INTSTK$Q_REGBASE | Used to index into registers. |
INTSTK$Q_GP | r1 - Used as global pointer. |
INTSTK$Q_R2 | r2 - temporary register. |
INTSTK$Q_R3 | r3 - temporary register. |
INTSTK$Q_R4 through R7 | r4 through r7 - preserved registers (not saved by interrupt). |
INTSTK$Q_R8 | r8 - return value. |
INTSTK$Q_R9 | r9 - argument pointer. |
INTSTK$Q_R10 | r10 - temporary register. |
INTSTK$Q_R11 | r11 - temporary register. |
INTSTK$Q_SSD | For future use. |
INTSTK$Q_R13 | r13 - Thread Pointer. |
INTSTK$Q_R14 through R31 | r14 through r31 - temporary registers. |
INTSTK$Q_B0 | Return pointer on kernel entry. |
INTSTK$Q_B1 through B5 | b1 through b5 - Preserved branch registers (not saved by interrupt). |
INTSTK$Q_B6 | b6 - temporary branch register. |
INTSTK$Q_B7 | b7 - temporary branch register. |
INTSTK$L_IVT_OFFSET | Offset in IVT. |
INTSTK$Q_F6 through F11 | f6 through f11 - temporary FP registers. |
If OpenVMS encounters a fatal exception, you can find the code that signaled it by examining the PC in the signal array. Use the SHOW CRASH or CLUE CRASH command to display the PC and the instruction stream around the PC to locate the exception.
The following display shows the SDA output in response to the SHOW CRASH and SHOW STACK commands for an Alpha SSRVEXCEPT bugcheck. It illustrates the mechanism array, signal arrays, and the exception stack frame previously described.
Example 2-1 SHOW CRASH |
---|
OpenVMS (TM) Alpha system dump analyzer ...analyzing a selective memory dump... Dump taken on 30-AUG-2000 13:13:46.83 SSRVEXCEPT, Unexpected system service exception SDA> SHOW CRASH Time of system crash: 30-AUG-1996 13:13:46.83 Version of system: OpenVMS (TM) Alpha Operating System, Version V7.3 System Version Major ID/Minor ID: 3/0 System type: DEC 3000 Model 400 Crash CPU ID/Primary CPU ID: 00/00 Bitmask of CPUs active/available: 00000001/00000001 CPU bugcheck codes: CPU 00 -- SSRVEXCEPT, Unexpected system service exception System State at Time of Exception --------------------------------- Exception Frame: ---------------- R2 = 00000000.00000003 R3 = FFFFFFFF.80C63460 EXCEPTION_MON_NPRW+06A60 R4 = FFFFFFFF.80D12740 PCB R5 = 00000000.000000C8 R6 = 00000000.00030038 R7 = 00000000.7FFA1FC0 PC = 00000000.00030078 PS = 00000000.00000003 00000000.00030068: STQ R27,(SP) 00000000.0003006C: BIS R31,SP,FP 00000000.00030070: STQ R26,#X0010(SP) 00000000.00030074: LDA R28,(R31) PC => 00000000.00030078: LDL R28,(R28) 00000000.0003007C: BEQ R28,#X000007 00000000.00030080: LDQ R26,#XFFE8(R27) 00000000.00030084: BIS R31,R26,R0 00000000.00030088: BIS R31,FP,SP PS => MBZ SPAL MBZ IPL VMM MBZ CURMOD INT PRVMOD 0 00 00000000000 00 0 0 KERN 0 USER Signal Array ------------ Length = 00000005 Type = 0000000C Arg = 00000000.00010000 Arg = 00000000.00000000 Arg = 00000000.00030078 Arg = 00000000.00000003 %SYSTEM-F-ACCVIO, access violation, reason mask=00, virtual address=0000000000000000, PC=0000000000030078, PS=00000003 Saved Scratch Registers in Mechanism Array ------------------------------------------ R0 = 00000000.00020000 R1 = 00000000.00000000 R16 = 00000000.00020004 R17 = 00000000.00010050 R18 = FFFFFFFF.FFFFFFFF R19 = 00000000.00000000 R20 = 00000000.7FFA1F50 R21 = 00000000.00000000 R22 = 00000000.00010050 R23 = 00000000.00000000 R24 = 00000000.00010051 R25 = 00000000.00000000 R26 = FFFFFFFF.8010ACA4 R27 = 00000000.00010050 R28 = 00000000.00000000 CPU 00 Processor crash information ---------------------------------- CPU 00 reason for Bugcheck: SSRVEXCEPT, Unexpected system service exception Process currently executing on this CPU: SYSTEM Current image file: $31$DKB0:[SYS0.][SYSMGR]X.EXE;1 Current IPL: 0 (decimal) CPU database address: 80D0E000 CPUs Capabilities: PRIMARY,QUORUM,RUN General registers: R0 = 00000000.00000000 R1 = 00000000.7FFA1EB8 R2 = FFFFFFFF.80D0E6C0 R3 = FFFFFFFF.80C63460 R4 = FFFFFFFF.80D12740 R5 = 00000000.000000C8 R6 = 00000000.00030038 R7 = 00000000.7FFA1FC0 R8 = 00000000.7FFAC208 R9 = 00000000.7FFAC410 R10 = 00000000.7FFAD238 R11 = 00000000.7FFCE3E0 R12 = 00000000.00000000 R13 = FFFFFFFF.80C6EB60 R14 = 00000000.00000000 R15 = 00000000.009A79FD R16 = 00000000.000003C4 R17 = 00000000.7FFA1D40 R18 = FFFFFFFF.80C05C38 R19 = 00000000.00000000 R20 = 00000000.7FFA1F50 R21 = 00000000.00000000 R22 = 00000000.00000001 R23 = 00000000.7FFF03C8 R24 = 00000000.7FFF0040 AI = 00000000.00000003 RA = FFFFFFFF.82A21080 PV = FFFFFFFF.829CF010 R28 = FFFFFFFF.8004B6DC FP = 00000000.7FFA1CA0 PC = FFFFFFFF.82A210B4 PS = 18000000.00000000 Processor Internal Registers: ASN = 00000000.0000002F ASTSR/ASTEN = 0000000F IPL = 00000000 PCBB = 00000000.003FE080 PRBR = FFFFFFFF.80D0E000 PTBR = 00000000.00001136 SCBB = 00000000.000001DC SISR = 00000000.00000000 VPTB = FFFFFFFC.00000000 FPCR = 00000000.00000000 MCES = 00000000.00000000 CPU 00 Processor crash information ---------------------------------- KSP = 00000000.7FFA1C98 ESP = 00000000.7FFA6000 SSP = 00000000.7FFAC100 USP = 00000000.7AFFBAD0 No spinlocks currently owned by CPU 00 |
Example 2-2 SHOW STACK |
---|
SDA> SHOW STACK Current Operating Stack (KERNEL): 00000000.7FFA1C78 18000000.00000000 00000000.7FFA1C80 00000000.7FFA1CA0 00000000.7FFA1C88 00000000.00000000 00000000.7FFA1C90 00000000.7FFA1D40 SP => 00000000.7FFA1C98 00000000.00000000 00000000.7FFA1CA0 FFFFFFFF.829CF010 EXE$EXCPTN 00000000.7FFA1CA8 FFFFFFFF.82A2059C EXCEPTION_MON_PRO+0259C 00000000.7FFA1CB0 00000000.00000000 00000000.7FFA1CB8 00000000.7FFA1CD0 00000000.7FFA1CC0 FFFFFFFF.829CEDA8 EXE$SET_PAGES_READ_ONLY+00948 00000000.7FFA1CC8 00000000.00000000 00000000.7FFA1CD0 FFFFFFFF.829CEDA8 EXE$SET_PAGES_READ_ONLY+00948 00000000.7FFA1CD8 00000000.00000000 00000000.7FFA1CE0 FFFFFFFF.82A1E930 EXE$CONTSIGNAL_C+001D0 00000000.7FFA1CE8 00000000.7FFA1F40 00000000.7FFA1CF0 FFFFFFFF.80C63780 EXE$ACVIOLAT 00000000.7FFA1CF8 00000000.7FFA1EB8 00000000.7FFA1D00 00000000.7FFA1D40 00000000.7FFA1D08 00000000.7FFA1F00 00000000.7FFA1D10 00000000.7FFA1F40 00000000.7FFA1D18 00000000.00000000 00000000.7FFA1D20 00000000.00000000 00000000.7FFA1D28 00000000.00020000 SYS$K_VERSION_04 00000000.7FFA1D30 00000005.00000250 BUG$_NETRCVPKT 00000000.7FFA1D38 829CE050.000008F8 BUG$_SEQ_NUM_OVF CHF$IS_MCH_ARGS 00000000.7FFA1D40 00000000.0000002C CHF$PH_MCH_FRAME 00000000.7FFA1D48 00000000.7AFFBAD0 CHF$IS_MCH_DEPTH 00000000.7FFA1D50 FFFFFFFF.FFFFFFFD CHF$PH_MCH_DADDR 00000000.7FFA1D58 00000000.00000000 CHF$PH_MCH_ESF_ADDR 00000000.7FFA1D60 00000000.7FFA1F00 CHF$PH_MCH_SIG_ADDR 00000000.7FFA1D68 00000000.7FFA1EB8 CHF$IH_MCH_SAVR0 00000000.7FFA1D70 00000000.00020000 SYS$K_VERSION_04 CHF$IH_MCH_SAVR1 00000000.7FFA1D78 00000000.00000000 CHF$IH_MCH_SAVR16 00000000.7FFA1D80 00000000.00020004 UCB$M_LCL_VALID+00004 CHF$IH_MCH_SAVR17 00000000.7FFA1D88 00000000.00010050 SYS$K_VERSION_16+00010 CHF$IH_MCH_SAVR18 00000000.7FFA1D90 FFFFFFFF.FFFFFFFF CHF$IH_MCH_SAVR19 00000000.7FFA1D98 00000000.00000000 CHF$IH_MCH_SAVR20 00000000.7FFA1DA0 00000000.7FFA1F50 CHF$IH_MCH_SAVR21 00000000.7FFA1DA8 00000000.00000000 CHF$IH_MCH_SAVR22 00000000.7FFA1DB0 00000000.00010050 SYS$K_VERSION_16+00010 CHF$IH_MCH_SAVR23 00000000.7FFA1DB8 00000000.00000000 CHF$IH_MCH_SAVR24 00000000.7FFA1DC0 00000000.00010051 SYS$K_VERSION_16+00011 CHF$IH_MCH_SAVR25 00000000.7FFA1DC8 00000000.00000000 CHF$IH_MCH_SAVR26 00000000.7FFA1DD0 FFFFFFFF.8010ACA4 AMAC$EMUL_CALL_NATIVE_C+000A4 CHF$IH_MCH_SAVR27 00000000.7FFA1DD8 00000000.00010050 SYS$K_VERSION_16+00010 CHF$IH_MCH_SAVR28 00000000.7FFA1DE0 00000000.00000000 00000000.7FFA1DE8 00000000.00000000 00000000.7FFA1DF0 00000000.00000000 00000000.7FFA1DF8 00000000.00000000 00000000.7FFA1E00 00000000.00000000 00000000.7FFA1E08 00000000.00000000 00000000.7FFA1E10 00000000.00000000 00000000.7FFA1E18 00000000.00000000 00000000.7FFA1E20 00000000.00000000 00000000.7FFA1E28 00000000.00000000 00000000.7FFA1E30 00000000.00000000 00000000.7FFA1E38 00000000.00000000 00000000.7FFA1E40 00000000.00000000 00000000.7FFA1E48 00000000.00000000 00000000.7FFA1E50 00000000.00000000 00000000.7FFA1E58 00000000.00000000 00000000.7FFA1E60 00000000.00000000 00000000.7FFA1E68 00000000.00000000 00000000.7FFA1E70 00000000.00000000 00000000.7FFA1E78 00000000.00000000 00000000.7FFA1E80 00000000.00000000 00000000.7FFA1E88 00000000.00000000 00000000.7FFA1E90 00000000.00000000 00000000.7FFA1E98 00000000.00000000 CHF$PH_MCH_SIG64_ADDR 00000000.7FFA1EA0 00000000.7FFA1ED0 00000000.7FFA1EA8 00000000.00000000 00000000.7FFA1EB0 00000000.7FFA1F50 00000000.7FFA1EB8 0000000C.00000005 00000000.7FFA1EC0 00000000.00010000 SYS$K_VERSION_07 00000000.7FFA1EC8 00000003.00030078 SYS$K_VERSION_01+00078 CHF$L_SIG_ARGS 00000000.7FFA1ED0 00002604.00000005 UCB$M_TEMPLATE+00604 CHF$L_SIG_ARG1 00000000.7FFA1ED8 00000000.0000000C 00000000.7FFA1EE0 00000000.00010000 SYS$K_VERSION_07 00000000.7FFA1EE8 00000000.00000000 00000000.7FFA1EF0 00000000.00030078 SYS$K_VERSION_01+00078 00000000.7FFA1EF8 00000000.00000003 INTSTK$Q_R2 00000000.7FFA1F00 00000000.00000003 INTSTK$Q_R3 00000000.7FFA1F08 FFFFFFFF.80C63460 EXCEPTION_MON_NPRW+06A60 INTSTK$Q_R4 00000000.7FFA1F10 FFFFFFFF.80D12740 PCB INTSTK$Q_R5 00000000.7FFA1F18 00000000.000000C8 INTSTK$Q_R6 00000000.7FFA1F20 00000000.00030038 SYS$K_VERSION_01+00038 INTSTK$Q_R7 00000000.7FFA1F28 00000000.7FFA1FC0 INTSTK$Q_PC 00000000.7FFA1F30 00000000.00030078 SYS$K_VERSION_01+00078 INTSTK$Q_PS 00000000.7FFA1F38 00000000.00000003 Prev SP (7FFA1F40) ==> 00000000.7FFA1F40 00000000.00010050 SYS$K_VERSION_16+00010 00000000.7FFA1F48 00000000.00010000 SYS$K_VERSION_07 00000000.7FFA1F50 FFFFFFFF.8010ACA4 AMAC$EMUL_CALL_NATIVE_C+000A4 00000000.7FFA1F58 00000000.7FFA1F70 00000000.7FFA1F60 00000000.00000001 00000000.7FFA1F68 FFFFFFFF.800EE81C RM_STD$DIRCACHE_BLKAST_C+005AC 00000000.7FFA1F70 FFFFFFFF.80C6EBA0 SCH$CHSEP+001E0 00000000.7FFA1F78 00000000.829CEDE8 EXE$SIGTORET 00000000.7FFA1F80 00010050.00000002 SYS$K_VERSION_16+00010 00000000.7FFA1F88 00000000.00020000 SYS$K_VERSION_04 00000000.7FFA1F90 00000000.00030000 SYS$K_VERSION_01 00000000.7FFA1F98 FFFFFFFF.800A4D64 EXCEPTION_MON_NPRO+00D64 00000000.7FFA1FA0 00000000.00000003 00000000.7FFA1FA8 FFFFFFFF.80D12740 PCB 00000000.7FFA1FB0 00000000.00010000 SYS$K_VERSION_07 00000000.7FFA1FB8 00000000.7AFFBAD0 00000000.7FFA1FC0 00000000.7FFCF880 MMG$IMGHDRBUF+00080 00000000.7FFA1FC8 00000000.7B0E9851 00000000.7FFA1FD0 00000000.7FFCF818 MMG$IMGHDRBUF+00018 00000000.7FFA1FD8 00000000.7FFCF938 MMG$IMGHDRBUF+00138 00000000.7FFA1FE0 00000000.7FFAC9F0 00000000.7FFA1FE8 00000000.7FFAC9F0 00000000.7FFA1FF0 FFFFFFFF.80000140 SYS$PUBLIC_VECTORS_NPRO+00140 00000000.7FFA1FF8 00000000.0000001B . . . |
When an illegal page fault occurs, the stack appears as pictured in Figure 2-8.
Figure 2-8 Stack Following an Illegal Page-Fault Error
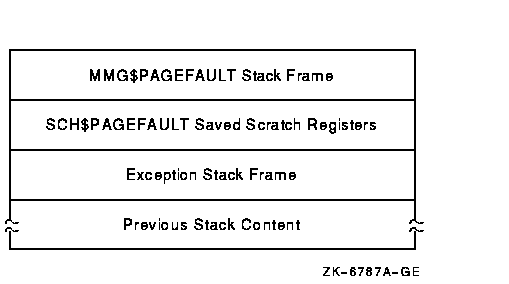
The stack contents are as follows:
MMG$PAGEFAULT Stack Frame | Stack frame built at entry to MMG$PAGEFAULT, the page fault exception service routine. On Alpha, the frame includes the contents of the following registers at the time of the page fault: R3, R8, R11 to R15, R29 (frame pointer) |
SCH$PAGEFAULT Saved Scratch Registers (Alpha only) | Contents of the following registers at the time of the page fault: R0, R1, R16 to R28 |
Exception Stack Frame | Exception stack frame ---see Figure 2-5, Figure 2-6 and Figure 2-7 |
Previous Stack Content | Contents of the stack prior to the illegal page-fault error |
When you analyze a dump caused by a PGFIPLHI bugcheck, the SHOW STACK
command identifies the exception stack frame using the symbols shown in
Table 2-11 or Table 2-12. The SHOW CRASH or CLUE CRASH command
displays the instruction that caused the page fault and the
instructions around it.
2.8 Page Protections and Access Rights
Page protections and access rights are different on Alpha and Integrity server systems. They are visible in output from the following commands:
SHOW PAGE
SHOW PROCESS/PAGE
EXAMINE/PTE
EVALUATE/PTE
Due to system differences, there is a need to distinguish "Write+Read+Execute" from "Write+Read" and to distinguish "Read+Execute" from "Read".
On an Alpha system, W=W+R+E and R=R+E but on an IA64 system, additional w and r indicators are introduced for non-execute cases.
On Alpha, page protection is described by 8 bits--- one Read bit for each mode, and one Write Bit. Therefore in the "Read" column, there might be KESU (read access in all modes) or K--- (read access in Kernel mode only) or NONE (no read access). Similarly in the "Writ" column. Not all combinations of the 8 bits are possible (for example, Write access for a mode implies Read access at that mode and both Read and Write access for all inner modes).
On Integrity servers, page protection is described by 5 bits, a combination of the Access Rights and Privilege Level fields. SDA interprets these with a single character to describe access in each mode, as shown in Table 2-13.
Code | Meaning |
---|---|
r | Read |
w | Read, Write |
R | Read, Execute |
W | Read, Write, Execute |
X | Execute |
K | Promote to Kernel |
E | Promote to Executive |
S | Promote to Supervisor |
- | No access |
For example
WRRR
means Kernel mode has Read+Write+Execute access; all other modes have
Read+Execute access.
2.9 Inducing a System Failure
If the operating system is not performing well and you want to create a dump you can examine, you must induce a system failure. Occasionally, a device driver or other user-written, kernel-mode code can cause the system to execute a loop of code at a high priority, interfering with normal system operation. This loop can occur even though you have set a breakpoint in the code if the loop is encountered before the breakpoint. To gain control of the system in such circumstances, you must cause the system to fail and then reboot it.
If the system has suspended all noticeable activity and is hung, see the examples of causing system failures in Section 2.9.2.
If you are generating a system failure in response to a system hang, be
sure to record the PC and PS as well as the contents of the integer
registers at the time of the system halt.
2.9.1 Meeting Crash Dump Requirements
The following requirements must be met before the operating system can write a complete crash dump:
This section tells you how to enter the XDelta utility (XDELTA) to force a system failure.
Before you can use XDelta, it must be loaded at system startup. To load XDelta during system bootstrap, you must set bit 1 in the boot flags. See the HP OpenVMS Version 8.4 Upgrade and Installation Manual for information about booting with the XDelta utility.
On Alpha, put the system in console mode by pressing Ctrl/P or the Halt push button. Enter the following commands at the console prompt to enter XDelta:
>>> DEPOSIT SIRR E >>> CONTINUE |
On Integrity servers, enter XDELTA by pressing Ctrl/P at the console.
Once you have entered XDelta, use any valid XDelta commands to examine register or memory locations, step through code, or force a system failure (by entering ;C under XDelta). See the HP OpenVMS Delta/XDelta Debugger Manual for more information about using XDelta.
On Alpha, if you did not load XDelta, you can force a system crash by entering console commands that make the system incur an exception at high IPL. At the console prompt, enter commands to set the program counter (PC) to an invalid address and the PS to kernel mode at IPL 31 before continuing. This results in a forced INVEXCEPTN-type bugcheck. Some HP Alpha computers employ the console command CRASH (which will force a system failure) while other systems require that you manually enter the commands.
Enter the following commands at the console prompt to force a system failure:
>>> DEPOSIT PC FFFFFFFFFFFFFF00 >>> DEPOSIT PS 1F00 >>> CONTINUE |
For more information, refer to the hardware manuals that accompanied your Alpha computer.
On Integrity servers, pressing Ctrl/P when XDelta is not loaded causes the OpenVMS system to output the following:
Crash (y/n): |
A response of Y forces a system crash; entering any other character lets the system continue processing.
Previous | Next | Contents | Index |