HP OpenVMS Availability Manager User's Guide
2.8.3 Using the Event Pane
The event pane occupies the bottom part of the System Overview window
(Figure 2-25). In this pane, the Data Analyzer displays events that
occur on all the nodes being monitored on your system, including nodes
that might not be displayed currently in the Group/Node pane.
Events signal potential problems that might require
further investigation. An event must reach a certain level of severity
to be displayed. You can customize the severity levels at which events
are displayed (see Chapter 7). For more information about
displaying events, see Chapter 5.
The events that are signalled depend on the types of data collection
that are performed (see Section 2.8.2.5).
In the System Overview window, you can change the size of the panes as
well as the width of specific fields. You can also change the borders
between the fields by placing the mouse on the border, displaying a
double-headed arrow, and dragging the border to the right or left.
Scroll bars indicate whether you are displaying all or part of a pane.
For example, clicking a right arrow on a scroll bar allows you to view
the rightmost portion of a screen.
2.8.4 Other System Overview Window Components
In addition to panes, the System Overview window (Figure 2-25) also
includes features such as a title bar, menu bar, and status bar:
Title bar
The title bar runs across the top of the window and contains the
product name and version.
Menu bar
The menu bar, immediately below the title bar, contains the following
menu options:
- File
The File menu contains the Exit option,
which allows you to stop the Data Analyzer and close the window.
- Customize
The Customize menu contains options
that allow you to customize various aspects of the Data Analyzer. These
options are explained in Chapter 7.
- Help
The Help menu offers different types of
online help for the Data Analyzer. These options are explained in
Section 2.9.
Status bar
The status bar, which runs across the bottom of the window, displays
the following:
- The name of the selected group and the number of nodes in that
group.
- The Java Virtual Machine memory statistics - the current amount of
memory used and the maximum amount of memory. If the current amount of
memory stays close or is equal to the maximum amount of memory, various
odd behaviors may occur including hanging data collections for nodes,
unable to show dialog boxes, etc. due to the lack of memory.
- The current time in a colored box. The color of the box goes from
green (the Data Analyzer is keeping up with the amount incoming data)
to red (the Data Analyzer is having trouble processing the amount of
incoming data), and various shades in between.
Displaying More Information at Any Time
In the initial System Overview window (Figure 2-25), which is
displayed by default, you can perform the following actions at any time
during the display:
- Click on a field to select it.
- Double-click most fields to display a page containing information
specific to that field.
- Right-click a field to display a shortcut menu with additional
choices on it.
2.9 Getting Help
To obtain online help, click on the Help menu on the
System Overview window menu
bar. Then choose one of the following options, which are displayed at
the top of the page.
| Menu Option |
Description |
|
Availability Manager User Manual
|
Information about using the Availability Manager.
|
|
Getting Started
|
A special online version of help for getting started using this tool.
|
|
Availability Manager Release Notes
|
Last-minute information about the software and how it works.
|
|
About Availability Manager...
|
Information about this Availability Manager Data Analyzer release (such as the
copyright date).
|
2.10 Printing a Display
The Data Analyzer does not provide a printscreen capability. However,
you can capture Data Analyzer displays and print them by following
these steps:
- Click on the selected Data Analyzer display to make it your active
window.
- Press the key combination
Alt + PrintScreen
.
This action copies the image of the display into your copy buffer.
(To capture the entire screen, press
Ctrl + PrintScreen
.)
- Run the Windows Paint program:
Start --> Programs --> Accessories --> Paint
|
- Do one of the following:
- Press the key combination
Ctrl + V
.
- From Paint's Edit menu, select
Paste
.
- Then do one of the following:
- Select an option from Paint's File menu. For example:
- Save or Save As...: to name the file containing the display image
and place it in a directory that you specify.
- Print: to print the display image on a printer that you select.
- Use one of Paint's editing options to edit the display image before
saving or printing it.
Chapter 3
Getting Information About Nodes
Note
Before you start this chapter, be sure to read the explanation of data
collection, events, thresholds, and occurrences as well as background
and foreground data collection in Chapter 1. HP also recommends
completing the getting-started steps described in Chapter 2.
|
Node summary data is the only data that is collected by default. The
Data Analyzer looks for events only in data that is being collected.
You can collect additional data in either of the following ways:
- Open any display page that contains node-specific data (for
example, CPU, memory, I/O) automatically starts foreground data
collection and event analysis except for Lock Contention and Cluster
Summary information. (You must select these tabs individually to start
foreground data collection.) Collection and evaluation continue as long
as a page with node-specific data is displayed.
- Click a check mark on the Data Collection Customization page (which
you can select on the Customize OpenVMS... menu) enables background
collection of that type of data. Data is collected and events are
analyzed continuously until you remove the check mark.
For additional information about how to change these settings, see
Chapter 7.
This chapter describes the node data that the Data Analyzer displays by
default and more detailed data that you can choose to display.
Differences are noted whenever information displayed for OpenVMS nodes
differs from that displayed for Windows nodes.
Although Cluster Summary is one of the tabs displayed on the OpenVMS
Node Summary page (Figure 3-4), see Chapter 4 for a detailed
discussion of OpenVMS Cluster data.
Note
On many node displays, you can hold the cursor over a data field or
column header to display an explanation of that field or header in a
small rectangle, called a tooltip. Figure 3-2
contains an example.
Some tooltips can be rather large. To ensure that the tooltip stays up
as long as you need to read it, move the mouse slightly over the field
to keep the tooltip visible.
|
3.1 Group/Node Pane
The Data Analyzer automatically displays data for each node within the
groups displayed in the Group/Node pane of the Application window
(Figure 3-1).
Figure 3-1 OpenVMS Group/Node Pane
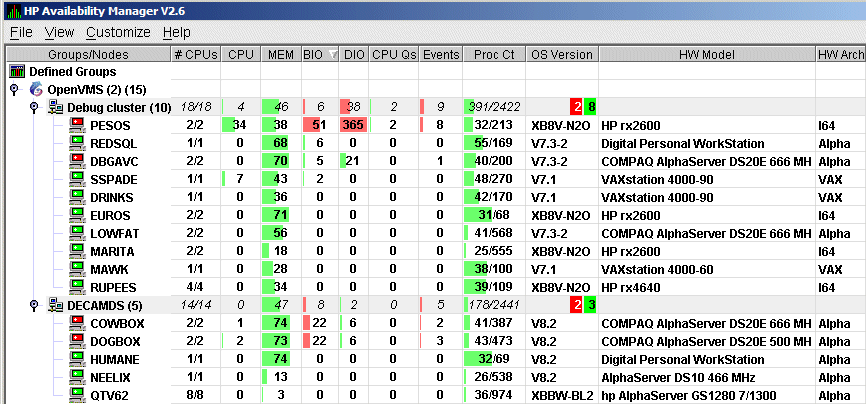
Recall that the colors of the icons represent the following states:
| Color |
Description |
|
Brown
|
Attempts to configure the node have failed---for example, because the
nodes are in a connection failed state.
|
|
Yellow
|
Node security check is in progress.
|
|
Black
|
Network path to node has been lost, or the node is not running.
|
|
Red
|
Security check was successful. However, a threshold has been exceeded,
and an event has been posted.
|
|
Green
|
Security check was successful; data is being collected.
|
If you hold the cursor over a node name, the Data Analyzer displays a
tooltip explaining the specific reason for the color that precedes the
node name. By holding the cursor over many column headers and some data
items on Data Analyzer screens, you can display tooltips. Figure 3-2
is an example of a tooltip that explains the BIO column header in the
Group/Node pane.
Figure 3-2 Sample Tooltip

The colors and their meanings are in Table 3-1.
Table 3-1 Explanation of Tooltip Colors in the Group/Node Pane
| Color |
Meaning |
|
Brown
|
Indicates why the configuration of the node failed.
|
|
Yellow
|
Shows number of RM Driver multicast "Hello" messages
and the number of attempts to configure the node ("Configuration
packets sent"). Nodes that remain in this state more than a few
seconds indicate network connectivity problems with the Data Analyzer.
|
|
Black
|
Shows one of the following:
|
|
If the node was successfully configured and then lost,
-- When the connection to the node was lost ("Path lost at
time").
-- When that node was booted ("Boot time:
time").
-- What the uptime of the node was ("Uptime:
time").
|
|
|
If the node was never configured,
-- When the connection to the node was lost ("Path lost at
time").
-- The reason the node was not configured.
|
|
|
Red
|
If an event causes the output of any message besides an informational
one, a node is displayed in red.
|
|
Green
|
Nodes are in the data collection state.
|
The following sections describe the data displayed for OpenVMS and
Windows Group/Node panes.
3.1.1 OpenVMS Node Data
Node data with a graph displayed in red indicates that the amount is
above the threshold set for the field. For each OpenVMS node and group
it recognizes, the Data Analyzer displays the data described in
Table 3-2. This table also lists the abbreviation of the event that
is related to each type of data, where applicable. See Section 7.8
for information about setting event thresholds. Appendix B describes
OpenVMS and Windows events.
Note that you can sort the order in which data is displayed in the Node
Pane by clicking a column header. To reverse the sort order of a column
of data, click the column header again.
Table 3-2 OpenVMS Node Data
| Data |
Description of Data |
Related Event |
|
Node Name
|
Name of the node being monitored.
|
n/a
|
|
CPU
1
|
Percentage of CPU usage of all processes on the node.
|
HICOMQ
HIMTTO
PRCCUR
PRCPUL
|
|
Active CPUs
|
The number of active CPUs over the number of CPUs in the potential set.
The potential set is the maximum number of CPUs available to the node.
|
n/a
|
|
MEM
|
Percentage of space in memory that all processes on the node use.
|
LOMEMY
|
|
PFLTS
|
Total page faults and hard page faults per second for all processes on
the node.
|
HITTLP
HIHRDP
|
|
PFW/COM
|
Number of processes in page fault wait (PFW) and compute (COM) states.
|
HICOMQ
HIPFWQ
|
|
BIO
|
Buffered I/O rate of processes on the node.
|
HIBIOR
|
|
DIO
|
Direct I/O usage of processes on the node.
|
HIDIOR
|
|
CPU Qs
|
Number of processes in one of the following states: COMO, MWAIT, COLPG,
FPG.
|
HICMOQ
HIMWTQ
HIPWTQ
|
|
Events
|
Number of triggered events that are associated with this node.
|
List of relevant events
|
|
Proc Ct
|
Actual count of processes over the maximum number of processes.
Percentage of actual to maximum processes.
|
HIPRCT
|
|
OS Version
|
Version of the operating system on the node.
|
NOPLIB
UNSUPP
|
|
HW Model
|
Hardware model of the node.
|
NOPLIB
UNSUPP
|
|
HW Arch
|
Hardware architecture: Alpha or VAX
|
n/a
|
|
DC
|
The Data Collector capability level and Managed Object registration
retrieval status.
Each version of the Data Collector has a capability level
associated with it. This value tells the Data Analyzer what
capabilities the Data Collector has (e.g. ability to execute disk
volume fixes). If the capability value is below what the Data Analyzer
will support, a MINCAP event will be signaled, and puts the node in the
connection failed state, and not collect data from the node.
The Managed Object registration retrieval status indicates whether
or not the Data Analyzer could get the data indicating what Managed
Objects have registered with the Data Collector. Managed Objects are
described more fully in Chapter 4.
The values for the Managed Object registration status are as
follows:
| Status |
Description |
|
D
|
Done. Managed Objects are not supported by the Data Collector. The Data
Analyzer will adjust collect data that the Data Collector supports.
|
|
NS
|
Not Sent. The Data Collector supports Managed Objects. The request for
the registration data has not been sent.
|
|
S
|
Sent. The request for the registration data has been sent, and the Data
Analyzer is waiting for the response.
|
|
V
|
Valid. The registration has been received and processed by the Data
Analyzer.
|
|
E
|
Error. There was an error in getting the registration data from the
Data Collector.
|
|
MINCAP
|
1By default, the CPU heading follows Node Name on a line of
Node pane data. You can use the cursor to move a column heading to
another location on the line, if you like.
3.1.2 Windows Node Pane
Figure 3-3 is an example of a Windows Node pane.
From the group you select, the Data Analyzer displays all the nodes
with which it can communicate.
Figure 3-3 Windows Node Pane

For each Windows node in the group, the Data Analyzer displays the data
described in Table 3-3.
Table 3-3 Windows Node Data
| Data |
Description |
|
Node Name
|
Name of the node being monitored.
|
|
CPU
|
Percentage of CPU usage of all the processes on the node.
|
|
MEM
|
Percentage of memory that is in use.
|
|
DIO
|
Direct I/O usage of processes on the node.
|
|
Processes
|
Number of processes on the node.
|
|
Threads
|
Number of threads on the node. A thread is a basic executable entity
that can execute
instructions in a processor.
|
|
Events
|
The number of events on the node. An event is used when two or more
threads want to synchronize execution.
|
|
Semaphores
|
The number of semaphores on the node.
Threads use semaphores to control access to data structures that they
share with other threads.
|
|
Mutexes
|
The number of mutexes on the node. Threads use mutexes to ensure that
only one thread executes a section of code at a time.
|
|
Sections
|
The number of sections on the node. A section is a portion of virtual
memory created by a process for storing data. A process can share
sections with other processes.
|
|
OS Version
|
Version of the operating system on the node.
|
|
HW Model
|
Hardware model of the node.
|
3.2 Node Data Pages
The following sections describe node data pages, which you can display
in any of the following ways:
- Double-click a data item in the Group/Node or Node pane to display
an associated page.
- Double-click a node name on the Group/Node or Node pane to display
a Node Summary page (Figure 3-4). You can then click other tabs on
the Node Summary page to display the same detailed data that you
display by double-clicking a data item in the Group/Node or Node pane.
- Double-click an event in the Event pane.
The menu bar on each node data page contains the options described in
Table 3-4.
Table 3-4 Node Data Page Menu Bar
| Menu Option |
Description |
For More Information |
|
File
|
Contains the Close option, which you can choose to exit from the pages.
|
n/a
|
|
View
|
Contains options that allow you to view data from another perspective.
|
See specific pages.
|
|
Fix
|
Contains options that allow you to resolve various resource
availability problems and improve system performance.
|
Chapter 6
|
|
Customize
|
Contains options that allow you to organize data collection and
analysis and to display data by filtering and customizing data
collected from Data Collectors.
|
Chapter 7
|
The following sections describe individual node data pages.
3.2.1 Node Summary
When you double-click a node name, operating system (OS) version, or
hardware model in an OpenVMS Group/Node pane (Figure 2-25) or a
Windows Node pane (Figure 3-3), the Data Analyzer displays the Node
Summary page (Figure 3-4).
Figure 3-4 Node Summary
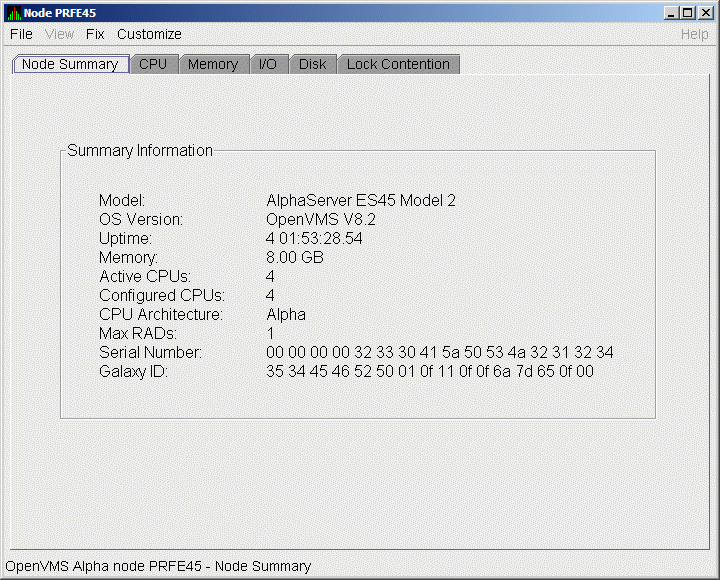
On this page, the following information is displayed for the selected
node:
| Data |
Description |
|
Model
|
System hardware model name.
|
|
OS Version
|
Name and version of the operating system.
|
|
Uptime
|
Time (in days, hours, minutes, and seconds) since the last reboot.
|
|
Memory
|
Total amount of physical memory (in MBs or GBs) found on the system.
|
|
Active CPUs
|
Number of CPUs running on the node.
|
|
Configured CPUs
|
Number of CPUs that are configured to run on the node.
|
|
Max RADs
|
Maximum number of resource affinity domains (RADs) for this node.
|
|
Serial Number
|
The system's hardware serial number retrieved from the Hardware Restart
Parameter Block (HWRPB).
|
|
Galaxy ID
|
The Galaxy ID uniquely identifies a Galaxy. Instances in the same
Galaxy have the same Galaxy ID.
|
3.2.2 CPU Modes and Process Summaries
By clicking the CPU tab, you can display CPU panes that contain more
detailed statistics about CPU mode usage and process summaries than the
Node Summary does. You can use the CPU panes to diagnose issues that
CPU-intensive users or CPU bottlenecks might cause. For OpenVMS nodes,
you can also display information about specific CPU processes.
When you double-click a value under the CPU or CPU Qs heading on either
an OpenVMS Group/Node or a Windows Node pane, or when you click the CPU
tab, the Data Analyzer displays the CPU Mode Summary in the top pane
(Figure 3-6) and, by default, CPU Mode Details (Figure 3-7) in
the lower pane. You can use the View menu to select the CPU Process
Summary in the lower pane ( Section 3.2.2.4).
CPU mode summaries and process summary panes are described in the
following sections. Note that there are differences between the pages
displayed for OpenVMS and Windows nodes.
3.2.2.1 Windows CPU Modes
Figure 3-5 provides an example of a Windows CPU Modes page. The
sample page contains values for the three CPU modes---user, privileged,
and null.
Figure 3-5 Windows CPU Modes
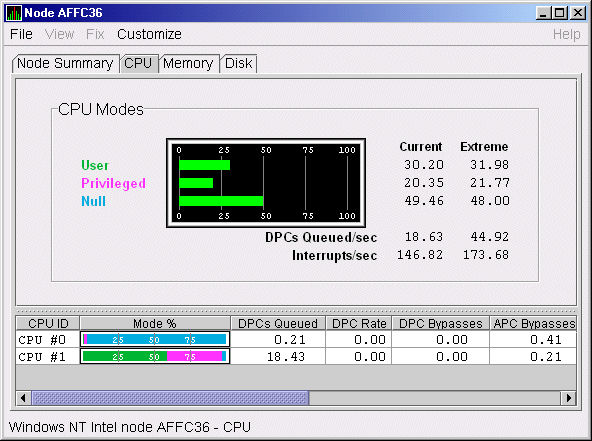
The top pane of the Windows CPU Modes page is a summary of Windows CPU
usage, listed by type of mode.
On the left, the following CPU modes are listed:
On the graph, values that exceed thresholds are displayed in red. To
the right of the graph are current and extreme amounts for each mode.
Current and extreme amounts are also displayed for the following values:
- Deferred procedure calls (DPCs) queued per second
- Interrupts that occurred per second
The lower pane of the Windows CPU Modes contains modes details. The
following data is displayed:
| Data |
Description |
|
CPU ID
|
Decimal value representing the identity of a processor in a
multiprocessing system. On a uniprocessor, this value is always CPU #00.
|
|
Mode %
|
Graphical representation of the percentage of active modes on that CPU.
The color displayed matches the mode color on the graph on the top pane.
|
|
DPCs Queued
|
Rate that deferred procedure call (DPC) objects are queued to this
processor's DPC queue.
|
|
DPC Rate
|
Average rate that DPC objects are queued to this processor's DPC queue
per clock tick.
|
|
DPC Bypasses
|
Rate that dispatch interrupts were short-circuited.
|
|
APC Bypasses
|
Rate that kernel asynchronous procedure
call (APC) interrupts were short-circuited.
|
3.2.2.2 OpenVMS CPU Mode Summary and Process States
Figure 3-6 shows sample OpenVMS CPU Mode Summary and CPU Process
States, which are the left and right top panes of the CPU Modes page.
Figure 3-6 OpenVMS CPU Mode Summary and Process States
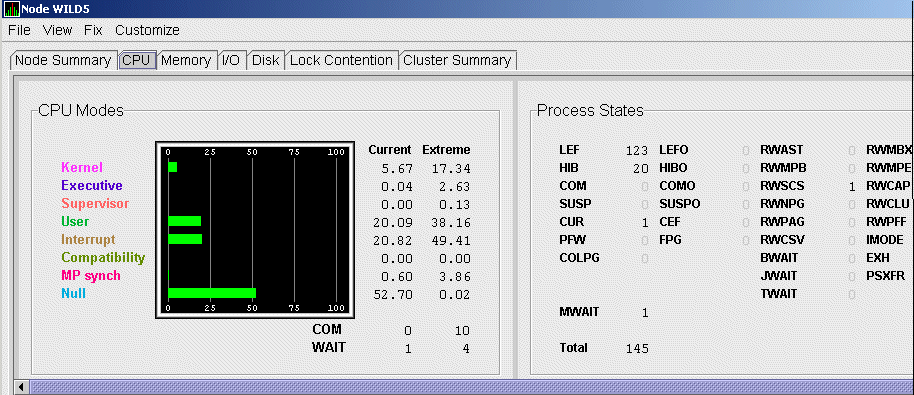
CPU Mode Summary
In the CPU Mode Summary section of the pane, percentages are averaged
across all
the CPUs and are displayed as a single value on symmetric
multiprocessing (SMP) nodes.
To the left of the graph is a list of CPU modes. The bars in the graph
represent the percentage of CPU cycles used for each mode. To the right
of the graph are current and extreme percentages of time spent in each
mode.
Below the graph, the Data Analyzer displays the COM and WAIT process
queues:
- COM: The value displayed is the number of processes in the COM and
COMO states.
- WAIT: The value displayed is the number of processes in the
miscellaneous WAIT, MWAIT, COLPG, CEF, PFW, and FPG states.
CPU Process States
The right side of Figure 3-6 shows a sample CPU Process States
display. Note that the value for MWAIT, in the left column, is the sum
of all values for the states in the two right columns.
This display shows the number of processes in each process state. This
number is tallied from the data in CPU Process view of the CPU page
(Figure 3-6). For systems with many processes, the data in the CPU
Process view is collected in segments over a short period of time
because the amount of data a network packet can contain is limited.
Because of this, the number of processes in the Process States pane
might differ slightly from what is reported in $MONITOR STATES.
Appendix A contains explanations of the CPU process states.
3.2.2.3 OpenVMS CPU Mode Details
The lower pane of the CPU Modes page contains CPU mode details, as
shown in Figure 3-7.
Figure 3-7 OpenVMS CPU Mode Details Pane
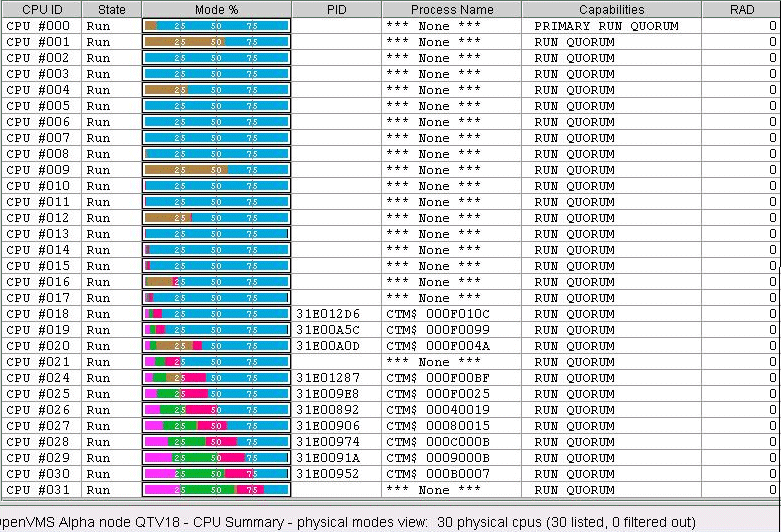
In the OpenVMS CPU Mode Details pane, the following data is displayed:
| Data |
Description |
|
CPU ID
|
Decimal value representing the identity of a processor in a
multiprocessing system. On a uniprocessor, this value is always CPU #00.
|
|
State
|
One of the following CPU states: Boot, Booted, Init, Rejected,
Reserved, Run, Stopped, Stopping, or Timeout.
|
|
Mode %
|
Graphical representation of the percentage of active modes on that CPU.
The color displayed coincides with the mode color in the graph in the
top pane.
|
|
PID
|
Process identifier (PID) value of the process that is using the CPU. If
the PID is unknown to the Data Analyzer application, the internal PID
(IPID) is listed.
|
|
Process Name
|
Name of the process active on the CPU. If no active process is found on
the CPU, the name is listed as *** None ***.
|
|
Capabilities
|
One or more of the following CPU capabilities or flags:
- Capabilities: Primary, Quorum, Run, or Vector.
- Flags: Idle, Lckmgr, Fastpath_CPU, Fastpath_Ports, Low_power, and
Cothread_of_
nn.
|
|
RAD
|
Number of the RAD where the CPU exists.
|
The status bar in the OpenVMS CPU Mode Details pane (see Figure 3-7)
shows the potential number of physical CPUs on the node, the number
that are listed, and the number that are filtered out. The status bar
is updated with each data collection. The data collection rate is
determined by the customization of CPU mode data collection intervals.
See Section 7.5 for instructions on how to change data collection
intervals.
3.2.2.4 OpenVMS CPU Process Summary
To display the OpenVMS CPU Process Summary pane at the bottom of the
CPU page, select CPU Process Summary from the View menu
(Figure 3-6). Figure 3-8 shows a sample OpenVMS CPU Process
Summary pane.
Figure 3-8 OpenVMS CPU Process Summary Pane

The OpenVMS CPU Process Summary pane displays the following data:
| Data |
Description |
|
PID
|
Process identifier, a 32-bit value that uniquely identifies a process.
|
|
Process Name
|
Name of the process active on the CPU.
|
|
Priority
|
Computable
(xx) and base
(yy) process priority in the format
xx/yy.
|
|
State
|
One of the process states listed in Appendix A.
|
|
Rate
|
Percentage of CPU time used by this process. This is the ratio of CPU
time to elapsed time. The CPU rate is also displayed in the bar graph.
|
|
Wait
|
Percentage of time the process is in the COM or COMO state.
|
|
Time
|
Amount of actual CPU time charged to the process.
|
|
Home RAD
|
Where most of the resources of the process reside.
|
Displaying Single Process Information
When you double-click a PID on the lower part of an OpenVMS CPU Process
Summary (Figure 3-8), Memory Summary (Figure 3-10), or I/O Summary
(Figure 3-12) page, the Data Analyzer displays the first of several
OpenVMS Single Process pages.
On these pages, you can click tabs to display specific data about one
process. Alternatively, you can display all of the information on the
pages on a single vertical or horizontal grid page.
This data includes a combination of data elements from the CPU Process,
Memory, and I/O pages, as well as data for specific quota utilization,
current image, and queue wait time. These pages are described in more
detail in Section 3.3.
The status bar in the OpenVMS CPU Process Summary Pane (Figure 3-8)
shows the total number of processes on the node, the number that are
listed, and the number that are filtered out. The status bar is updated
with each data collection. The data collection rate is determined by
the customization of CPU process data collection intervals. See
Section 7.5 for instructions on how to change data collection
intervals.
3.2.3 Memory Summaries and Details
The Memory Summary and Memory Details pages contain statistics about
memory usage on the node you select.
The Memory Summary pages displayed for OpenVMS and Windows nodes are
somewhat different, as described in the following sections. The Memory
Details page exists only for OpenVMS systems.
3.2.3.1 Windows Memory Summary
To display the Windows Memory Summary page, you can use either of the
following methods:
- Double-click a node, and then click the Memory tab (Figure 3-3).
- Double-click a value under the MEM heading (Figure 3-3).
The Data Analyzer displays the Windows Memory page (Figure 3-9).
Figure 3-9 Windows Memory
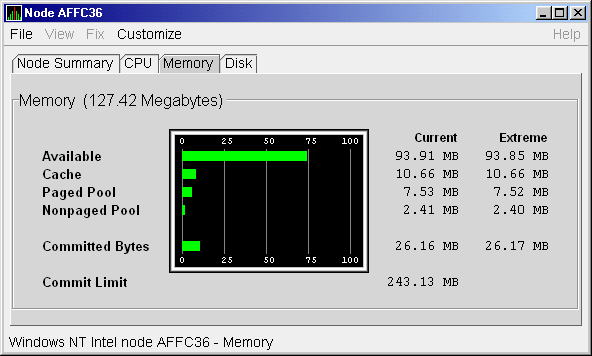
The Current and Extreme amounts on the page display the data shown in
the following table. The table also indicates what the graph amounts
represent.
| Data |
Description |
|
Available
|
Size (in bytes) of the virtual memory currently on the
zeroed, free, and standby lists. Zeroed and free memory are ready for
use, with zeroed memory cleared to zeros. Standby memory is removed
from a process's working set but is still available. The graph shows
the percentage of physical memory that is available for use.
|
|
Cache
|
Number of bytes currently in use by the
system cache. The system cache is used to buffer data retrieved from
disk or LAN. The system cache uses memory not in use by active
processes on the computer. The graph shows the percentage of physical
memory devoted to the cache.
|
|
Paged Pool
|
Number of bytes in paged pool, a system
memory area where operating system components acquire space as they
complete their tasks. Paged pool pages can be paged out to the paging
file when the system does not access them for long periods of time. The
graph shows the percentage of physical memory devoted to paged pool.
|
|
Nonpaged Pool
|
Number of bytes in nonpaged pool, a system
memory area where operating system components acquire space as they
complete their tasks. Nonpaged pool pages cannot be paged out to the
paging file; instead, they remain in memory as long as they are
allocated. The graph shows the percentage of physical memory devoted to
nonpaged pool.
|
|
Committed Bytes
|
Amount of available virtual memory (the Commit Limit) that is in use.
Note that the commit limit can change if the paging file is extended.
The graph shows the percentage of the Commit Limit used by the
Committed Bytes.
|
|
Commit Limit
|
Size (in bytes) of virtual memory that can be committed without having
to extend the paging files. If the paging files can be extended, this
limit can be raised.
|
3.2.3.2 OpenVMS Memory Summary
When you double-click a value under the MEM heading in an OpenVMS Node
pane, or if you click the Memory tab, the Data Analyzer displays the
OpenVMS Memory Summary page (Figure 3-10).
Alternatively, if you click the View menu on the OpenVMS Memory Summary
page, the following options are displayed in a shortcut menu:
- Memory Summary View
- Memory Details View
You can click Memory Summary View to select the Memory Summary page,
shown in Figure 3-10.
Figure 3-10 OpenVMS Memory Summary
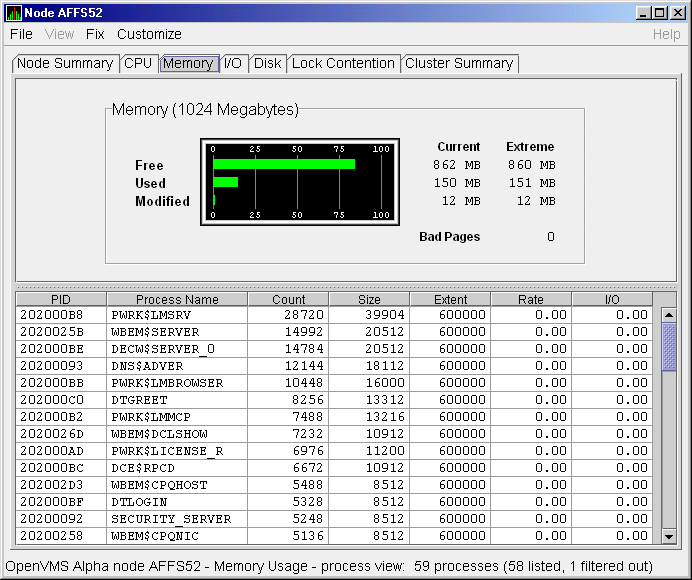
The graph in the top pane of Figure 3-10 shows memory distribution
(Free, Used, and Modified) as absolute values, in megabytes of memory.
Current and extreme values are also listed for each type of memory
distribution. (Free memory uses the lowest seen value as its extreme.)
Bad Pages show the number of pages that the operating system has marked
as bad.
The thresholds that you see in the graph are the ones set for the
LOMEMY event. (The LOMEMY thresholds are also in the display of values
for the MEM field in the OpenVMS Group/Node pane shown in
Figure 2-25.)
The lower pane in Figure 3-10 displays the data shown in the
following table, including an abbreviation of the event that is related
to each type of data, where applicable.
| Data |
Description |
Related Events |
|
PID
|
Process identifier. A 32-bit value that uniquely identifies a process.
|
n/a
|
|
Process Name
|
Name of the process.
|
NOPROC,
PRCFND
|
|
Count
|
Number of physical pages or pagelets of memory that the process is
using for the working set count.
|
LOWEXT
|
|
Size
|
Number of pages or pagelets of memory the process is allowed to use for
the working set size (also known as the working set list size). The
operating system periodically adjusts this value based on an analysis
of page faults relative to CPU time used.
|
LOWSQU
|
|
Extent
|
Number of pages or pagelets of memory in the process's working set
extent (WSEXTENT) quota as defined in the user authorization file
(UAF). Number of pages or pagelets cannot exceed the value of the
system parameter WSMAX.
|
LOWEXT
|
|
Rate
|
Number of page faults per second for the process.
|
LOWSQU,
LOWEXT,
PRPGFL
|
|
I/O
|
Rate of I/O read attempts necessary to satisfy page faults (also known
as page read I/O or the hard fault rate).
|
PRPIOR
|
When you double-click a PID on the lower part of the Memory Summary
page (Figure 3-10), the Data Analyzer displays an OpenVMS Single
Process (Figure 3-23), where you can click tabs to display pages
containing specific data about one process. This data includes a
combination of data from the CPU Process, Memory, and I/O pages, as
well as data for specific quota utilization, current image, and queue
wait time. These pages are described in Section 3.3.
The status bar in the Memory Summary page (Figure 3-10) shows the
total number of processes on the node, the number that are listed, and
the number that are filtered out. The status bar is updated with each
data collection. The data collection rate is determined by the
customization of memory data collection intervals. See Section 7.5
for instructions on how to change data collection intervals.
3.2.3.3 OpenVMS Memory Details
When you click the View menu on the OpenVMS Memory Summary page
(Figure 3-10), the following options are displayed in a shortcut
menu. To display memory details, select that option.
- Memory Summary View
- Memory Details View (Alpha only)
The Data Analyzer displays the OpenVMS Memory Details page
(Figure 3-11).
Figure 3-11 OpenVMS Memory Details
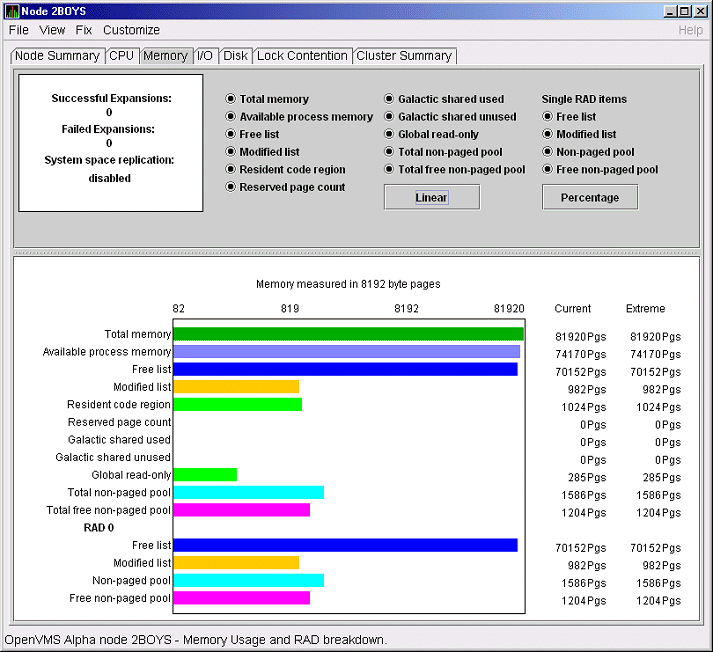
The following data items are in a box at the top left of the page:
| Heading |
Description |
|
Successful Expansions
|
Number of successful nonpaged pool expansions.
|
|
Failed Expansions
|
Number of failed attempts to expand nonpaged pool.
|
|
System space replication
|
Whether system space replication is enabled or disabled.
|
To the right of the box is a list of system memory data that is
displayed in the bar graphs at the bottom of the page. You can toggle
these data items on or off (that is, to display them as bar graphs).
You can also click a small box to choose between Linear and Logarithmic
bar graph displays.
The system memory data items are described in Table 3-5.
Table 3-5 System Memory Data
| Data |
Description |
|
Total memory
|
Total physical memory size, as seen by OpenVMS.
|
|
Available process memory
|
Amount of total physical memory available to processes. This is the
total memory minus memory allocated to OpenVMS.
|
|
Free list
|
Size of the free page list.
|
|
Modified list
|
Size of the modified page list.
|
|
Resident code region
|
Size of the resident image code region.
|
|
Reserved page count
|
Number of reserved memory pages.
|
|
Galactic shared used
|
Galaxy shared memory pages currently in use.
|
|
Galactic shared unused
|
Galaxy shared memory pages currently not in use.
|
|
Global read-only
|
Read-only pages, which are installed as resident when system space
replication is enabled, that will also be replicated for improved
performance.
|
|
Total nonpaged pool
|
Total size of system nonpaged pool.
|
|
Total free nonpaged pool
|
Amount of nonpaged pool that is currently free.
|
To the right of the system memory data is a list of single RAD data
items, which are described in Section 3.3.7. You can toggle these items
to display them in bar graphs.
Table 3-6 Single RAD Data Items
| Data |
Description |
|
Free list
|
Size of the free page list.
|
|
Modified list
|
Size of the modified page list.
|
|
Nonpaged pool
|
Total size of system nonpaged pool.
|
|
Free nonpaged pool
|
Amount of nonpaged pool that is currently free.
|
Below the list of single RAD items is a box where you can toggle
between Percentage and Raw Data to display Current and Extreme values
to the right of the bar graphs.
3.2.4 OpenVMS I/O Summary and Page/Swap Files
By clicking the I/O tab on any OpenVMS node data page, you can display
a page that contains summaries of accumulated I/O rates. In the top
pane, the summary covers all processes; in the lower pane, the summary
is for one process.
From the View menu, you can also choose to display (in the lower pane)
a list of page and swap files.
3.2.4.1 OpenVMS I/O Summary
The OpenVMS I/O Summary page displays the rate, per second, at which
I/O transfers take place, including paging write I/O (WIO), direct I/O
(DIO), and buffered I/O (BIO). In the top pane, the summary is for all
CPUs; in the lower pane, the summary is for one process.
When you double-click a data item under the DIO or BIO heading on the
Node pane, or if you click the I/O tab, by default, the Data Analyzer
displays the OpenVMS I/O Summary (Figure 3-12).
Figure 3-12 OpenVMS I/O Summary
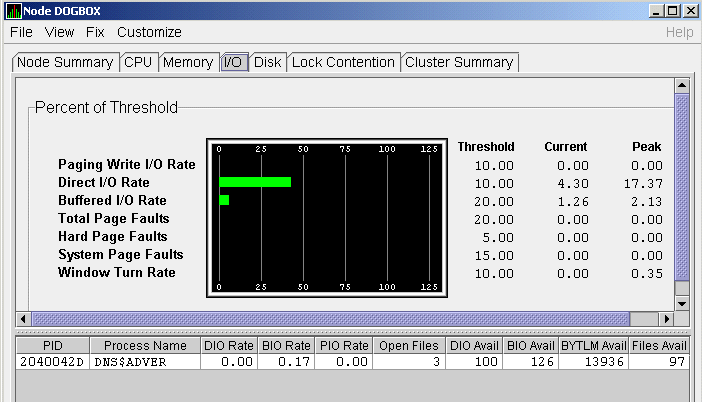
The graph in the top pane represents the percentage of thresholds for
the types of I/O shown in Table 3-7. The table also shows the event
that is related to each data item. For information about setting event
thresholds, see Section 7.8.
Table 3-7 I/O Data Displayed
| Type of I/O |
I/O Description |
Related Event |
|
Paging Write I/O Rate
|
Rate of write I/Os to one or more paging files.
|
HIPWIO
|
|
Direct I/O Rate
|
Transfers are from the pages or pagelets containing the process buffer
that the system locks in physical memory to the system devices.
|
HIDIOR
|
|
Buffered I/O Rate
|
Transfers are for the
process buffer from an intermediate buffer from the system buffer pool.
|
HIBIOR
|
|
Total Page Faults
|
Total of hard and soft page faults on the system, as
well as peak values seen during a Data Analyzer session.
|
HITTLP
|
|
Hard Page Faults
|
Total of hard page faults on the system.
|
HIHRDP
|
|
System Page Faults
|
Page faults generated by OpenVMS itself.
|
HISYSP
|
|
Window Turn Rate
|
Number of times that the file extent cache had to be refreshed.
|
WINTRN
|
Current and peak values are listed for each type of I/O.
Values that exceed thresholds set by the events indicated in the table
are displayed in red on the screen. Appendix B describes OpenVMS and
Windows events.
To the right of the graph, the following values are listed:
| Value |
Description |
|
Threshold
|
Defined in Event Configuration Properties.
|
|
Current
|
Current value or rate.
|
|
Peak
|
Highest value or rate seen since start of data collection.
|
The lower pane displays summary accumulated I/O rates on a per-process
basis. The following data is displayed:
| Data |
Description |
|
PID
|
Process identifier. A 32-bit value that uniquely identifies a process.
|
|
Process Name
|
Name of the current process.
|
|
DIO Rate
|
Direct I/O rate. The rate at which I/O transfers occur between the
system devices and the pages or pagelets that contain the process
buffer that the system locks in physical memory.
|
|
BIO Rate
|
Buffered I/O rate. The rate at which I/O transfers occur between the
process buffer and an intermediate buffer from the system buffer pool.
|
|
PIO Rate
|
Paging I/O rate. The rate of read attempts necessary to satisfy page
faults (also known as page read I/O or the hard fault rate).
|
|
Open Files
|
Number of open files.
|
|
DIO Avail
|
Direct I/O limit remaining. The number of remaining direct I/O limit
operations available before the process reaches its quota. DIOLM quota
is the maximum number of direct I/O operations a process can have
outstanding at one time.
|
|
BIO Avail
|
Buffered I/O limit remaining. The number of remaining buffered I/O
operations available before the process reaches its quota. BIOLM
quota is the maximum number of buffered I/O operations a process can
have outstanding at one time.
|
|
BYTLM
|
The number of buffered I/O bytes available before the process reaches
its quota. BYTLM is the maximum number of bytes of nonpaged system
dynamic memory that a process can claim at one time.
|
|
Files
|
Open file limit remaining. The number of additional files the process
can open before reaching its quota. The FILLM quota is the maximum
number of files that can be opened simultaneously by the process,
including active network logical links.
|
When you double-click a PID on the lower part of the I/O Summary page,
the Data Analyzer displays an OpenVMS Single Process, where you can
click tabs to display specific data about one process. See
Section 3.3 for more details.
The status bar in the OpenVMS I/O Summary page (Figure 3-12) shows
the total number of processes on the node, the number that are listed,
and the number that are filtered out. The status bar is updated with
each data collection. The data collection rate is determined by the
customization of I/O data collection intervals. See Section 7.5 for
instructions on how to change data collection intervals.
3.2.4.2 OpenVMS I/O Page/Swap Files
Click I/O Page/Swap Files on the I/O page View menu to select this
option. The
Data Analyzer displays an OpenVMS I/O Page/Swap Files page. The top
pane displays the same information as that in the OpenVMS I/O Summary
page Figure 3-12. The lower pane contains the I/O Page/Swap Files
pane shown in Figure 3-13.
Figure 3-13 OpenVMS I/O Page/Swap Files

The I/O Page/Swap Files pane displays the following data:
| Data |
Description |
|
Host Name
|
Name of the node on which the page or swap file resides.
|
|
File Name
|
Name of the page or swap file. For secondary page or swap files, the
file name is obtained by a special AST to the job controller on the
remote node. The Data Analyzer makes one attempt to retrieve the file
name.
|
|
Used
|
Number of used blocks in the file.
|
|
% Used
|
Of the available blocks in each file, the percentage that has been used.
|
|
Total
|
Total number of blocks in the file.
|
|
Reservable
|
The number of reservable blocks in each page or swap file currently
installed. Reservable blocks are blocks that might be logially claimed
by a process for future physical allocation. A negative value indicates
that the file might be overcommitted. Although a negative value is not
an immediate concern, it indicates that the file might become
overcommitted if physical memory becomes scarce.
|
Notes
OpenVMS Versions 7.3-1 and higher do not have a page or swap file
"Reservable" field. The Data Analyzer displays N/A in the
field for these versions of OpenVMS.
If events for secondary page and swap files are signaled before the
Data Analyzer has resolved their file names from the file ID (FID),
events such as LOPGSP display the FID instead of file name information.
You can determine the file name for the FID by checking the File Name
field in the I/O Page Swap Files page. The FID for the file name is
displayed after the file name.
|
The status bar in the OpenVMS I/O Page/Swap Files pane (Figure 3-13)
shows the total number of page and swap files on the node, the number
that are listed, and the number that are filtered out. The status bar
is updated with each data collection. The data collection rate is
determined by the customization of page/swap data collection intervals.
See Section 7.5 for instructions on how to change data collection
intervals.
3.2.5 Disk Summaries
The Disk tab on the Node Summary page (Figure 3-4) allows you to
display disk pages that contain data about availability, count, and
errors of disk devices on the system. OpenVMS disk data displays differ
from those for Windows nodes, as described in the following sections.
On OpenVMS pages, the View menu lets you choose the following disk
summaries:
- Status Summary
- Volume Summary
Also, on the Disk Status Summary, you can double-click a device name to
display a Single Disk Summary page.
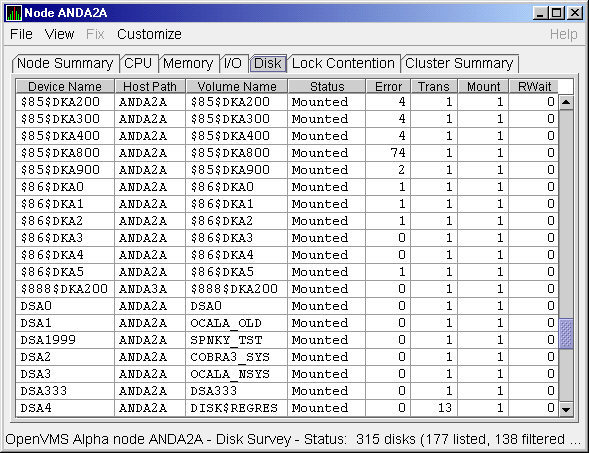
3.2.5.1 OpenVMS Disk Status Summary
To display the default disk page, the OpenVMS Disk Status Summary page
(Figure 3-14), click the Disk tab on the OpenVMS Node Summary page
(Figure 3-4). The Disk Status Summary page displays disk device
data, including path, volume name, status, and mount, transaction,
error, and resource wait counts.
Figure 3-14 OpenVMS Disk Status Summary
Note
Disk status data is accurate only if every node in an OpenVMS Cluster
environment is in the same group. You might lose accuracy if you do not
have all the nodes of a cluster in one group.
To ensure that the disk status data is accurate for an OpenVMS Cluster,
it is recommended that you enable background data collection for the
disk status data. See Section 7.5 on how to do this.
|
This summary displays the following data:
| Heading |
Description |
|
Device Name
|
Standard OpenVMS device name that indicates where the device is
located, as well as a controller or unit designation.
|
|
Host Path
|
Primary path (node) from which the device receives commands.
|
|
Volume Name
|
Name of the mounted media.
|
|
Status
|
One or more of the following disk status values:
|
Alloc
|
Disk is allocated to a specific user.
|
|
CluTran
|
Disk status is uncertain because of a cluster state transition in
progress.
|
|
Dismount
|
Disk in process of dismounting; may be waiting for a file to close.
|
|
Foreign
|
Disk is mounted with the /FOREIGN qualifier.
|
|
Invalid
|
Disk is in an invalid state (most likely Mount Verify Timeout).
|
|
MntVerify
|
Disk is waiting for a mount verification.
|
|
Mounted
|
Disk is logically mounted by a MOUNT command.
|
|
Offline
|
Disk is no longer physically mounted in device drive.
|
|
Online
|
Disk is physically mounted in device drive.
|
|
Shadow Set Member
|
Disk is a member of a shadow set.
|
|
Unavailable
|
Disk is set to unavailable.
|
|
Wrong Volume
|
Disk was mounted with the wrong volume name.
|
|
Wrtlck
|
Disk is mounted and write locked.
|
|
|
Error
|
Number of errors generated by the disk (a quick indicator of device
problems).
|
|
Trans
|
Number of in-progress file system operations for the disk.
|
|
Mount
|
Number of nodes that have the specified disk mounted. (These nodes must
have the Data Collector installed and running to be participate in the
mount count.)
|
|
Rwait
|
Indicator that a system I/O operation is stalled, usually during normal
recovery from a connection failure or during volume processing of
host-based shadowing.
|
The status bar in the OpenVMS Disk Status Summary (Figure 3-14) shows
the total number of volumes on the node, the number that are listed,
and the number that are filtered out. The status bar is updated with
each data collection. The data collection rate is determined by the
customization of disk status data collection intervals. See
Section 7.5 for instructions on how to change data collection
intervals.
3.2.5.2 OpenVMS Single Disk Summary
To collect single disk data and display the data on the Single Disk
Summary, double-click a device name on the Disk Status Summary.
Figure 3-15 is an example of a Single Disk Summary page. The display
interval of the data collected is 5 seconds.
Note that you can sort the order in which data is displayed in the
Single Disk Summary page by clicking a column header. To reverse the
sort order of a column of data, click the column header again.
Figure 3-15 OpenVMS Single Disk Summary
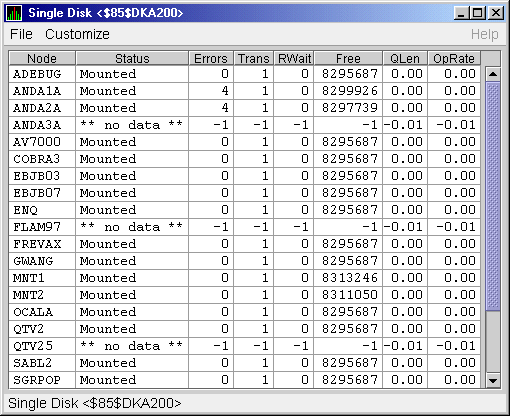
This summary displays the following data:
| Data |
Description |
|
Node
|
Name of the node.
|
|
Status
|
Status of the disk: mounted, online, offline, and so on.
|
|
Errors
|
Number of errors on the disk.
|
|
Trans
|
Number of in-progress file system operations on the disk (number of
open files on the volume).
|
|
Rwait
|
Indication of an I/O stalled on the disk.
|
|
Free
|
Number of free disk blocks on the volume.
|
|
QLen
|
Average number of operations in the I/O queue for the volume.
|
|
OpRate
|
Each node's contribution to the total operation rate (number of I/Os
per second) for the disk.
|
3.2.5.3 OpenVMS Disk Volume Summary
By using the View option on the Disk Status Summary page
(Figure 3-14), you can select the Volume Summary option to display
the OpenVMS Disk Volume Summary (Figure 3-16). This page displays
disk volume data, including path, volume name, disk block utilization,
queue length, and operation rate.
Figure 3-16 OpenVMS Disk Volume Summary

Note
Disk volume data is accurate only if every node in an OpenVMS Cluster
environment is in the same group. You might lose accuracy if you do not
have all the nodes of a cluster in one group.
To ensure that the disk volume data is accurate for an OpenVMS Cluster,
it is recommended that you enable background data collection for the
disk volume data. See Section 7.5 on how to do this.
|
The Disk Volume Summary page displays the data described in the
following table. (The last two columns, Volume Size and Volume Limit,
are displayed only on OpenVMS Version 7.3-2 and later systems.)
| Data |
Description |
|
Device Name
|
Standard OpenVMS device name that indicates where the device is
located, as well as a controller or unit designation.
|
|
Host Path
|
Primary path (node) from which the device receives commands.
|
|
Volume Name
|
Name of the mounted media.
|
|
Used
|
Number of blocks on the volume that are in use.
|
|
% Used
|
Percentage of the number of volume blocks in use in relation to the
total volume blocks available.
|
|
Free
|
Number of blocks of volume space available for new data from the
perspective of the node that is mounted.
|
|
Queue
|
Average number of I/O operations pending for the volume (an indicator
of performance; less than 1.00 is optimal).
|
|
OpRate
|
Operation rate for the most recent sampling interval. The rate measures
the amount of activity on a volume. The optimal load is device specific.
|
|
Physical Size
|
Total number of blocks on the current physical disk device. This is the
"Total Blocks" field of the $SHOW DEVICE/FULL display
|
|
Volume Size
|
Current number of blocks available for file allocation. This is the
"Logical Volume Size" field of the $SHOW DEVICE/FULL display. (For more
information, see $SET VOLUME/SIZE.) This column is displayed only on
OpenVMS Version 7.3-2 and later systems.
|
|
Volume Limit
|
Maximum number of blocks the volume can reach using Dynamic Volume
Expansion. This is the "Expansion Size Limit" of $SHOW DEVICE/FULL
display. (For more information, see $SET VOLUME/LIMIT.) This column is
displayed only on OpenVMS Version 7.3-2 and later systems.
|
If the Data Analyzer detects that a disk volume size has increased, an
VLSZCH event is signalled:
 AFFS55 Volume size of device $8$DKA200 (OPAL-X9U6) has changed
   ^                              ^          ^
  Node                          Device     Volume
  name                           name       name
|
The status bar in the OpenVMS Disk Volume Summary (Figure 3-16) shows
the total number of volumes on the node, the number that are listed,
and the number that are filtered out. The status bar is updated with
each data collection. The data collection rate is determined by the
customization of disk volume data collection intervals. See
Section 7.5 for instructions on how to change data collection
intervals.
3.2.5.4 Windows Logical and Physical Disk Summaries
On Windows nodes, the View menu lets you choose the following summaries:
- Logical Disk Summary
- Physical Disk Summary
Windows Logical Disk Summary
A logical disk is the user-definable set of partitions
under a drive letter. The Windows Logical Disk Summary displays logical
disk device data, including path, label, percentage used, free space,
and queue statistics.
To display the Logical Disk Summary page, follow these steps:
- Double-click a node name in the Node pane to display the Windows
Node Summary.
- Click the Disk tab on the Windows Node Summary.
The Data Analyzer displays the Windows Logical Disk Summary page
(Figure 3-17).
Figure 3-17 Windows Logical Disk Summary

This summary displays the following data:
| Data |
Description |
|
Disk
|
Drive letter, for example,
c:, or
Total, which is the summation of statistics for all the disks.
|
|
Path
|
Primary path (node) from which the device receives commands.
|
|
Label
|
Identifying label of a volume.
|
|
Type
|
File system type; for example, FAT or NTFS.
|
|
% Used
|
Percentage of disk space used.
|
|
Free
|
Amount of free space available on the logical disk unit.
|
|
Current Queue
|
Number of requests outstanding on the disk at the time the performance
data is collected. It includes requests in progress at the time of data
collection.
|
|
Average Queue
|
Average number of both read and write requests that were queued for the
selected disk during the sample interval.
|
|
Transfers/Sec
|
Rate of read and write operations on the disk.
|
|
KBytes/Sec
|
Rate data is transferred to or from the disk during write or read
operations. The rate is displayed in kilobytes per second.
|
|
% Busy
|
Percentage of elapsed time that the selected disk drive is busy
servicing read and write requests.
|
Windows Physical Disk Summary
A physical disk is hardware used on your computer
system. The Windows Physical Disk Summary displays disk volume data,
including path, label, queue statistics, transfers, and bytes per
second.
To display the Windows Physical Disk Summary, follow these steps:
- Click the View menu on the Windows Logical Disk Summary.
- Click the Physical Disk Summary menu option.
The Data Analyzer displays the Windows Physical Disk Summary page
(Figure 3-18).
Figure 3-18 Windows Physical Disk Summary

This page displays the following data:
| Data |
Description |
|
Disk
|
Drive number, for example, 0, 1, 2 or
Total, which is the summation of statistics for all the disks.
|
|
Path
|
Primary path (node) from which the device receives commands.
|
|
Current Queue
|
Number of requests outstanding on the disk at the time the performance
data is collected; it includes requests in service at the time of data
collection.
|
|
Average Queue
|
Average number of read and write requests that were queued for the
selected disk during the sample interval.
|
|
Transfers/Sec
|
Rate of read and write operations on the disk. The rate is displayed in
kilobytes per second.
|
|
KBytes/Sec
|
Rate bytes are transferred to or from the disk during read or write
operations. The rate is displayed in kilobytes per second.
|
|
% Busy
|
Percentage of elapsed time the selected disk drive is busy servicing
read and write requests.
|
|
% Read Busy
|
Percentage of elapsed time the selected disk drive is busy servicing
read requests.
|
|
% Write Busy
|
Percentage of elapsed time the selected disk drive is busy servicing
write requests.
|
3.2.6 OpenVMS Lock Contention
To display the OpenVMS Lock Contention page, click the Lock Contention
tab on the OpenVMS Node Summary page (Figure 3-4). For all the nodes
in the group you have selected, the Lock Contention page displays each
resource for which a lock contention problem might exist.
Note
Lock contention data is accurate only if every node in an OpenVMS
Cluster environment is in the same group. You might lose accuracy if
you do not have all the nodes of a cluster in one group.
To ensure that the lock contention data is accurate for an OpenVMS
Cluster, it is recommended that you enable background data collection
for the lock contention data. See Section 7.5 on how to do this.
|
3.2.6.1 Lock Contention Page in Decoded Format
Figure 3-19 shows a sample Lock Contention page containing resource
names in decoded format, which is the default.
Figure 3-19 OpenVMS Lock Contention (Decoded Format)
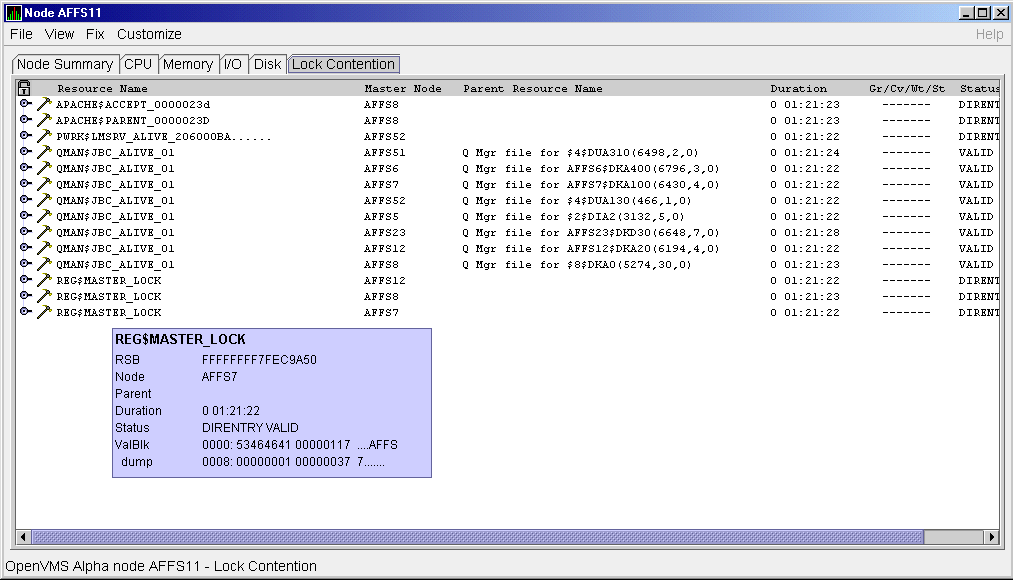
(You can display a tooltip similar to the one shown in Figure 3-19 by
holding the cursor on a resource line. See the Note in the introduction
to this chapter for further details.)
By selecting the View menu (on the Lock Contention page), followed by
the Resource names menu item, you can choose to display the resource
name and parent resource name in either of two formats:
- Raw format (the format that SDA uses)
- Decoded format (the default format)
Figure 3-19 displays the resource names in decoded format. (The Data
Analyzer decodes common resource names.)
The Lock Contention page displays the data described in Table 3-8.
Numbered lines correspond to lines or items of data in the Lock
Contention Log (Example 3-1).
Table 3-8 Data on the OpenVMS Lock Contention Page
| Lock Log Reference Number |
Data |
Description |
|
1
|
Resource Name
|
Resource name associated with the $ENQ system service call.
|
|
2
|
Master Node
|
Node on which the resource is mastered.
|
|
3
|
Parent Resource
|
Name of the parent resource. No name is displayed when a parent
resource does not exist.
|
|
4
|
Duration
|
Time elapsed since the Data Analyzer first detected the contention
situation.
|
|
5
|
Gr/Cv/Wt/St
|
Total number of locks in each of four states. Numbers for these states
appear only when you are collecting lock data. The states are:
- Granted
- Converting
- Waiting
- Stalled
Stalled indicates one of several states whenever a lock is
waiting for a response from another node in the cluster.
|
|
6
|
Status
|
Status of the lock. See the $ENQW description of flags in the
HP OpenVMS System Services Reference Manual.
|
The tooltip that is displayed when you hold the cursor over a line of
data in Figure 3-19 contains the data described in Table 3-8, as
well as the information described in Table 3-9.
3.2.6.2 Lock Contention Page in Raw Format
Figure 3-20 shows the Lock Contention page with resource name data
displayed in raw format. It also shows the tooltip that is displayed
when you hold the cursor over a line of data.
Figure 3-20 OpenVMS Lock Contention (Raw Format)
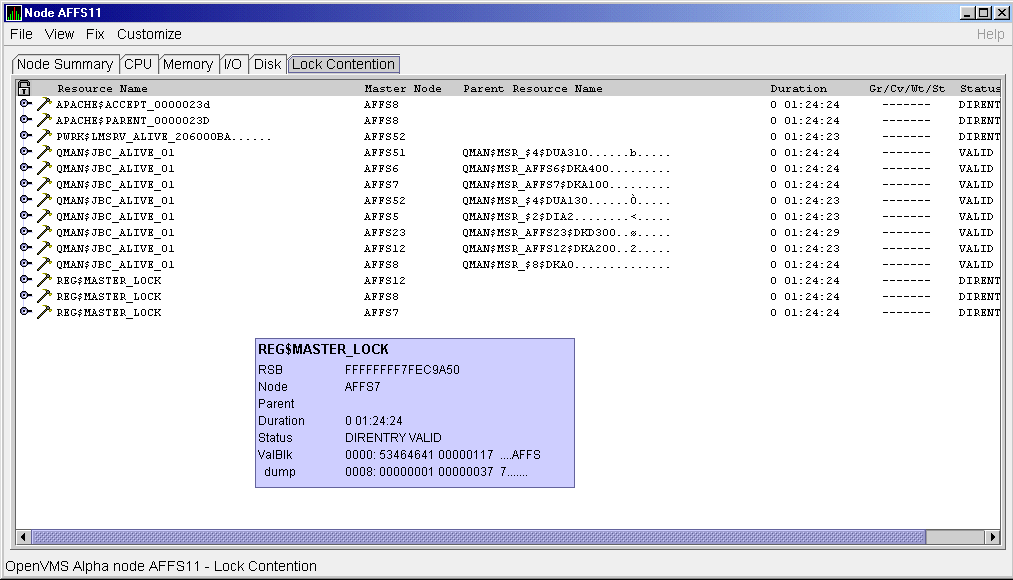
In Figure 3-20, notice that a period is substituted for each
unprintable character in the Resource Name and Parent Resource Name
fields.
3.2.6.3 Lock Block Data
When you click the handle that precedes any line of resource data, the
Data Analyzer displays the lock block data that is shown in
Figure 3-21 and Figure 3-22.
Figure 3-21 OpenVMS Lock Block Data
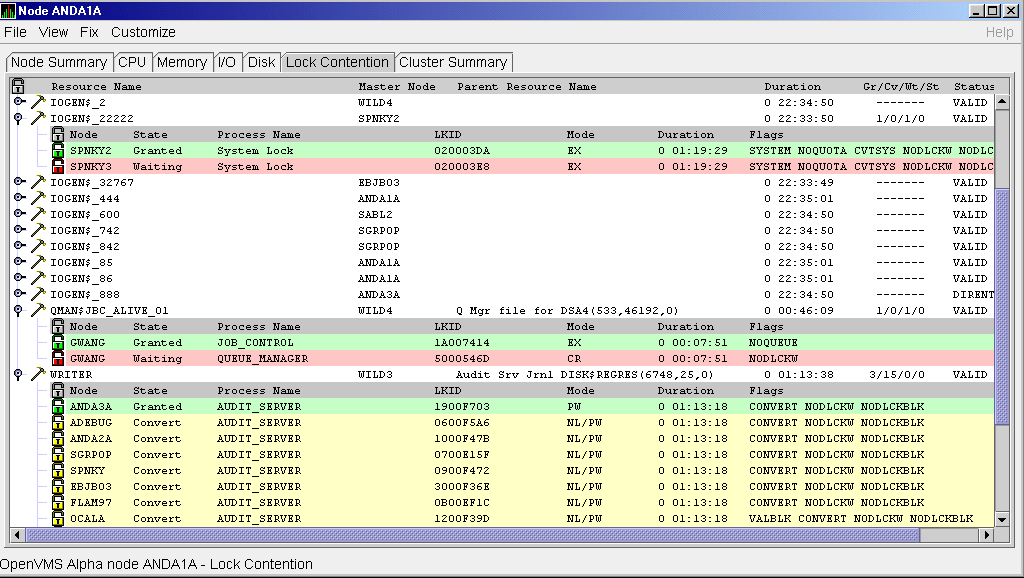
Figure 3-22 OpenVMS Lock Block Data (Retry Stalled
State)
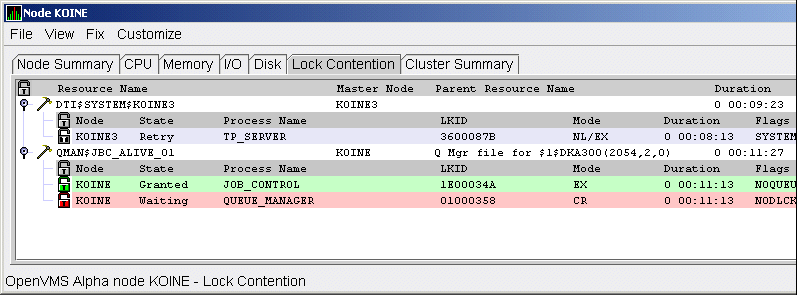
The lock block data in these two figures includes additional lock
information under the headings shown in Table 3-10. Numbered lines
correspond to lines or items of data in the Lock Contention Log
(Example 3-1).
Table 3-10 Lock Block Data
| Reference Number |
Data |
Description |
|
9
|
Node
|
Node name on which the lock is granted.
|
|
10
|
State
|
One of the following:
| Color |
Meaning |
|
Green
|
Granted
|
|
Yellow
|
Converting
|
|
Pink
|
Waiting
|
|
Pale grey
|
Stalled states that are visible:
SCSWAIT: A transient state indicating that a lock message has been
sent to the node with the master lock and a response is awaited.
RETRY: A transient state seen only under error conditions that
require that a lock message be resent. This can occur if the node to
which a lock message was sent goes down before a response from it is
received or if resources for sending a message cannot be allocated.
|
|
|
11
|
Process Name
|
Name of the process that owns the blocking lock.
|
|
12
|
LKID
|
Lock ID value (which is useful with SDA).
|
|
13
|
Mode
|
One of the following modes in which the lock is granted or requested:
1
|
CR
|
Concurrent read
|
Grants read access and allows resource sharing with other readers and
writers.
|
|
CW
|
Concurrent write
|
Grants write access and allows resource sharing with other groups.
|
|
EX
|
Exclusive
|
Grants write access and prevents resource sharing with any other
readers or writers.
|
|
NL
|
Null
|
Grants no access; used as an indicator of interest or a placeholder for
future lock conversion.
|
|
PR
|
Protected read
|
Grants read access and allows resource sharing with other readers, but
not writers.
|
|
PW
|
Protected write
|
Grants write access and prevents resource sharing with any other
readers or writers.
|
If one mode is displayed, it is the Granted mode; if two modes are displayed, the first is the Granted mode and the second is the Converting mode.
|
|
14
|
Duration
|
Length of time the lock has been in the current queue since the console
application found the lock.
|
|
15
|
Flags
|
Flags specified with the $ENQW request. See the $ENQW entry in
HP OpenVMS System Services Reference Manual.
|
1Descriptions are from Goldenberg, Ruth, and Saravanan,
Saro, OpenVMS AXP Internals and Data Structures, Version 1.5,
Digital Press, 1994.
To interpret the information displayed on the OpenVMS Lock Contention
page, you need to understand OpenVMS lock management services. For more
information, see the HP OpenVMS System Services Reference Manual.
3.2.6.4 Lock Block Log File
Example 3-1 contains an excerpt of a lock block log file. You can
find a lock block log file in either of the following locations:
| System |
File Name |
Location |
|
Windows
|
AvailManLock.log
|
Installation directory
|
|
OpenVMS
|
AvailManLock.log, prefaced by AMDS$AM_LOG
|
Directory to which AMDS$AM_LOG logical points
|
Numbers preceding lines or items of data in Example 3-1 correspond to
numbered lines in Table 3-8, Table 3-9, and Section 3.2.6.3.
Table 3-11 contains lines or items of data in a lock block log file
that are not described in the other tables in this section.
Table 3-11 Additional Data in the Lock Block Log File
| Lock Log Reference Number |
Data from Example |
Description |
|
16
|
Reason for logging
|
In the example, the reason for logging is "the number of locks has
changed." Other reasons include the "initial discovery of resource
contention" or "lock data collection has been turned on."
|
|
17
|
GGMODE/CGMODE
|
Lock has been Granted/Lock is Converting.
|
|
18
|
Resource Name Dump
|
OpenVMS style of Resource Name dump.
|
|
19
|
RDB global database name resource
|
Decoded Resource Name.
|
|
20
|
Parent Resource Name Dump
|
OpenVMS style of Parent Resource Name dump.
|
|
21
|
RDB global database name resource
|
Decoded Parent Resource Name.
|
|
22
|
Lock data is being collected
|
The handle preceding a line of lock data has been turned.
|
|
23
|
Master copy info. Remote Node
|
Remote node that contains the master copy of the lock. If "Local
Copy," only one node is interested in the lock.
|
|
24
|
Master copy info. Remote Lock ID
|
Lock ID of remote node that contains the master copy of the lock.
|
| Example 3-1 Lock Block Log File |
**************************************************
Time:  11-Nov-2003 14:54:13.656

16)Reason for logging:    Number of locks has changed

2) Master Lock Node:      ALTOS

1) Resource Name:         I.....
17)    GGMODE/CGMODE:     EX/EX
6)     Status:            VALID
7)     RSB Address:       FFFFFFFE.889F1580
18)    Resource Name Dump (includes initial count byte):
          0000:   000200 00004906  .I.....

8)     Value Block Dump:
          0000: 00000000 00000000  ........
          0008: 00000000 00000000  ........

19) Rdb Remote monitor resource
          #:                 2

3) Parent Resource Name:  Ý...D....VDEROOT     . 7....
7)     RSB Address:       FFFFFFFE.8847DB80
20)    Resource Name Dump (includes initial count byte):
          0000: 00004400 0000DD1C  .....D..
          0008: 4F4F5245 44560200  ..VDEROO
          0010: A0002020 20202054  T     ..
          0018:       00 00000237  7....

8)     Value Block Dump:
          0000: 00000000 00000000  ........
          0008: 00000000 00000000  ........

21)    Rdb global database name resource
          Disk volume name:  VDEROOT
          FID for file:      (14240,2,0)

22) Lock data is being collected

5)     Granted lock count:       1
5)     Conversion lock count:    0
5)     Waiting lock count:       4
5)     Stalled lock count:       0

       10)      9)               11)           12)      13) Master copy info:   15)
      Lock     Node   Process  Process         Lock    Gr/Cv Remote Remote   Flags
      State           PID      Name            ID       Mode Node   Lock ID
                                                              23)    24)
      Granted  ALTOS  28E00441 RDMS_MONITOR70  04014B37 EX    (Local copy)      NQUE SYNC SYS
      Waiting  ALTOS  2880023F RDMS_MONITOR70  4C0065B5 PR   TSAVO  32005001      SYNC SYS  NDLW
      Waiting  ALTOS  00000000 (EPID=28A0023D) 4C0144C4 PR   ETOSHA 74005E36      SYNC SYS  NDLW
      Waiting  ALTOS  28C00448 RDMS_MONITOR70  1D0144A3 PR   CHOBE  77005906      SYNC SYS  NDLW
      Waiting  ALTOS  28E026C3 VDE$KEPT126A3   01014B2D PR    (Local copy)             SYS  NDLW

**************************************************
|
3.3 OpenVMS Single Process Data
When you double-click a row in the lower part of an OpenVMS Mode
Details (Figure 3-7), OpenVMS CPU Process Summary (Figure 3-8),
Memory (Figure 3-10), or I/O (Figure 3-12) pages, the Data Analyzer
displays the first of several OpenVMS Single Process pages.
Alternatively, you can right-click a row and select
"Display...". The View menu item contains three display
options, shown in Figure 3-23.
Figure 3-23 Single Process Window
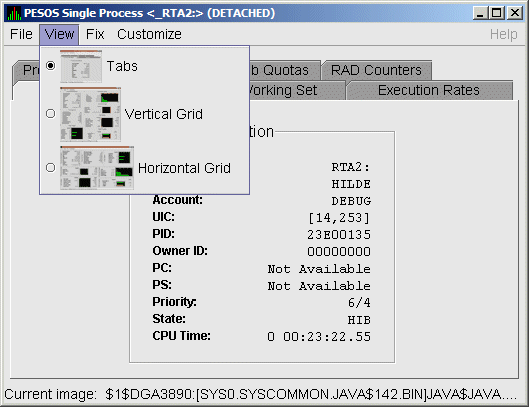
Explanations of the choices in the View menu are the following:
- Tabs: individual tabs for each Single Process display:
- Process Information
- Working Set
- Execution Rates
- Process Quotas
- Wait States
- Job Quotas
- RAD Counters
- Vertical Grid: all of the Single Process displays combined in one
vertically-oriented grid
- Horizontal Grid: all of the Single Process displays combined in one
horizontally-oriented grid
The following sections describe the individual tabs or sections of the
vertical or horizontal grids.
Each section refers to the vertical grid display shown in
Figure 3-24. The status bar displays the current image that the
process is running.
Figure 3-24 Single Process Vertical Grid Display
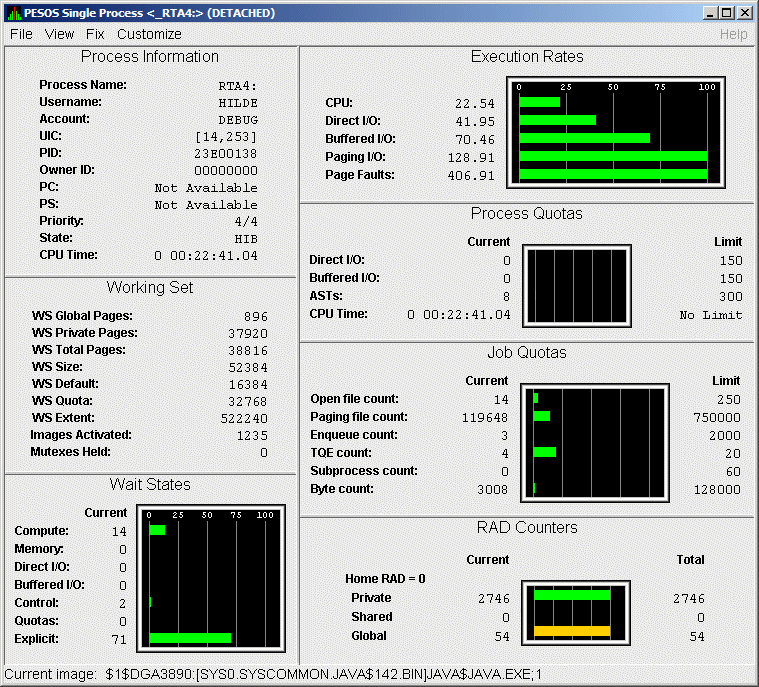
3.3.1 Process Information
Table 3-12 describes the Process Information data shown in
Figure 3-24.
The data on this page is displayed at the default intervals shown for
Single Process Data on the Data Collection Customization page.
Table 3-12 Process Information
| Data |
Description |
|
Process name
|
Name of the process.
|
|
Username
|
User name of the user who owns the process.
|
|
Account
|
Account string that the system manager assigns to the user.
|
|
UIC
|
User identification code (UIC). A pair of numbers or character strings
that designate the group and user.
|
|
PID
|
Process identifier. A 32-bit value that uniquely identifies a process.
|
|
Owner ID
|
Process identifier of the process that created the process displayed on
the page. If the PID is 0, then the process is a parent process.
|
|
PC
|
Program counter.
On OpenVMS Alpha systems, this value is displayed as 0 because the
data is not readily available to the Data Collector node.
|
|
PS
|
Processor status longword (PSL). This value is displayed on VAX systems
only.
|
|
Priority
|
Computable and base priority of the process. Priority is an integer
between 0 and 31. Processes with higher priority are given more CPU
time.
|
|
State
|
One of the process states listed in Appendix A.
|
|
CPU Time
|
CPU time used by the process.
|
3.3.2 Working Set
Table 3-13 describes the Working Set data shown in Figure 3-24.
Table 3-13 Working Set
| Data |
Description |
|
WS Global Pages
|
Shared data or code between processes, listed in pages (measured in
pagelets).
|
|
WS Private Pages
|
Amount of accessible memory, listed in pages (measured in pagelets).
|
|
WS Total Pages
|
Sum of global and private pages (measured in pagelets).
|
|
WS Size
|
Working set size. The number of pages (measured in pagelets) of memory
the process is allowed to use. This value is periodically adjusted by
the operating system based on analysis of page faults relative to CPU
time used. Increases in large units indicates that a process is taking
many page faults, and its memory allocation is increasing.
|
|
WS Default
|
Working set default. The initial limit of the number of physical pages
(measured in pagelets) of memory the process can use. This parameter is
listed in the user authorization file (UAF); discrepancies between the
UAF value and the displayed value are due to page/longword boundary
rounding or other adjustments made by the operating system.
|
|
WS Quota
|
Working set quota. The maximum amount of physical pages (measured in
pagelets) of memory the process can lock into its working set. This
parameter is listed in the UAF; discrepancies between the UAF value and
the displayed value are due to page/longword boundary rounding or other
adjustments made by the operating system.
|
|
WS Extent
|
Working set extent. The maximum number of physical pages (measured in
pagelets) of memory the system will allocate for the process. The
system provides memory to a process beyond its quota only when it has
an excess of free pages and can be recalled if necessary. This
parameter is listed in the UAF; any discrepancies between the UAF value
and the displayed value are due to page/longword boundary rounding or
other adjustments made by the operating system.
|
|
Images Activated
|
Number of times an image is activated.
|
|
Mutexes Held
|
Number of mutual exclusions (mutexes) held. Persistent values other
than zero (0) require analysis. A mutex is similar to a lock but is
restricted to one CPU. When a process holds a mutex, its priority is
temporarily increased to 16.
|
3.3.3 Execution Rates
Table 3-14 describes the Execution Rates data shown in
Figure 3-24.
Table 3-14 Execution Rates
| Data |
Description |
|
CPU
|
Percent of CPU time used by this process. The ratio of CPU time to
elapsed time.
|
|
Direct I/O
|
Rate at which I/O transfers take place from the pages or pagelets
containing the process buffer that the system locks in physical memory
to the system devices.
|
|
Buffered I/O
|
Rate at which I/O transfers take place for the process buffer from an
intermediate buffer from the system buffer pool.
|
|
Paging I/O
|
Rate of read attempts necessary to satisfy page faults. This is also
known as page read I/O or the hard fault rate.
|
|
Page Faults
|
Page faults per second for the process.
|
3.3.4 Process Quotas
Table 3-15 describes the Process Quotas data shown in Figure 3-24.
Note that when you display the SWAPPER process, no values are listed in
this section. The SWAPPER process does not have quotas defined in the
same way as other system and user processes do.
Table 3-15 Quotas
| Data |
Description |
|
Direct I/O
|
The current number of direct I/Os used compared with the limit possible.
|
|
Buffered I/O
|
The current number of buffered I/Os used compared with the possible
limit.
|
|
ASTs
|
Asynchronous system traps. The current number of ASTs used compared
with the possible limit.
|
|
CPU Time
|
Amount of time used compared with the possible limit. "No Limit" is
displayed if the limit is zero.
|
3.3.5 Wait States
Table 3-16 describes the Wait States data shown in Figure 3-24.
In the graph, "Current" refers to the percentage of elapsed
time each process spends in one of the computed wait states. If a
process spends all its time waiting in one state, the total gradually
reaches 100%.
How Wait States are Calculated
The wait state specifies why a process cannot execute, based on
calculations made on collected data. Each value is calculated over an
entire data collection period of approximately 2 minutes. The graph
shows, over this period of time, the percentage of time a process
spends in each wait state. Each value is an exponential average that
approximates a moving average. A more detailed explanation follows.
When monitoring of a single process starts, all wait state values are
zero. When the system periodically checks the process, the system first
subtracts 10% from each value. It then adds a value of 10 to the wait
state the process is currently in, if any.
For example, at the start, if a process is found to be in the Control
wait state, the graph immediately registers 10 for Control. If the
process is still in the Control wait state the next time it is checked,
the graph shows Control at 19. This value is 90% of the original 10 (or
9), plus 10 (the value currently being added).
The next time the process is checked, if it is found to be in the
Buffered I/O wait state, Buffered I/O is set to 10 and Control is set
to 17 (approximately 90% of the previous value of 19).
The following time the process is checked, if it is not in a wait state
at all, Buffered I/O is set to 9 (90% of 10), and Control is set to 15
(90% of 17).
Appendix A contains descriptions of wait states.
Table 3-16 Wait States
| Data |
Description |
|
Compute
|
Average percentage of time that the process is waiting for CPU time.
Possible states are COM, COMO, or RWCAP.
|
|
Memory
|
Average percentage of time that the process is waiting for a page fault
that requires data to be read from disk; this is common during image
activation. Possible states are PFW, MWAIT, COLPG, FPG, RWPAG, RWNPG,
RWMPE, or RWMPB.
|
|
Direct I/O
|
Average percentage of time that the process waits for data to be read
from or written to a disk or tape. The possible state is DIO.
|
|
Buffered I/O
|
Average percentage of time that the process waits for data to be read
from or written to a slower device such as a terminal, line printer,
mailbox, or network traffic. The possible state is BIO.
|
|
Control
|
Average percentage of time that the process is waiting for another
process to release control of some resource. Possible states are CEF,
MWAIT, LEF, LEFO, RWAST, RWMBX, RWSCS, RWCLU, RWCSV, RWUNK, or LEF
waiting for an ENQ.
|
|
Quotas
|
Average percentage of time that the process is waiting because the
process has exceeded some quota. Possible states are QUOTA or
RWAST_QUOTA.
|
|
Explicit
|
Average percentage of time that the process is waiting because the
process asked to wait, such as a hibernate system service. Possible
states are HIB, HIBO, SUSP, SUSPO, or LEF waiting for a TQE.
|
3.3.6 Job Quotas
Table 3-17 describes the Job Quota data shown in Figure 3-24.
Table 3-17 Job Quotas
| Data |
Description |
AUTHORIZE Quota |
|
Open File Count
|
Current number of open files compared with the possible limit.
|
FILLM
|
|
Paging File Count
|
Current number of disk blocks in the page file that the process can use
compared with the possible limit. Note that this value is in pagelets
(512 byte pages) for compatibility and consistency with VAX systems.
|
PGFLQUOTA
|
|
Enqueue Count
|
Current number of resources (lock blocks) queued compared with the
possible limit.
|
ENQLM
|
|
TQE Count
|
Current number of timer queue entry (TQE) requests compared with the
possible limit.
|
TQELM
|
|
Subprocess Count
|
Current number of subprocesses created compared with the possible limit.
|
PRCLM
|
|
Byte Count
|
Current number of bytes used for buffered I/O transfers compared with
the possible limit.
|
BYTLM
|
3.3.7 RAD Counters
Table 3-18 describes the RAD Counters data shown in Figure 3-24.
The RAD (Resource Affinity Domain) Counters data page is displayed for
Alpha and I64 systems.
Table 3-18 RAD Counters Data
| Data |
Description |
|
Private
|
Number of process private pages on RAD 0.
|
|
Shared
|
Number of process shared pages on RAD 0.
|
|
Global
|
Number of global pages on RAD 0.
|


