OpenVMS Alpha System Analysis Tools Manual
After a SET CPU command is issued (for analyzing a crash dump only),
the symbols defined in Table 2-6 are set for that CPU.
Table 2-6 SDA Symbols Defined by SET CPU Command
|
CPUDB
|
Address of CPU database
|
|
IPL
|
Interrupt priority level register
|
|
MCES
|
Machine check error summary register
|
|
PCBB
|
Process context block base register
|
|
PRBR
|
Processor base register (CPU database address)
|
|
RAD
|
Address of RAD database
|
|
SCBB
|
System control block base register
|
|
SISR
|
Software interrupt status register
|
|
VPTB
|
Virtual Page Table Base register
|
After a SET PROCESS command is issued, the symbols listed in
Table 2-7 are defined for that process.
Table 2-7 SDA Symbols Defined by SET PROCESS Command
|
ARB
|
Address of access rights block
|
|
FRED
|
Address of floating-point register and execution data block
|
|
JIB
|
Address of job information block
|
|
KTB
|
Address of the kernel thread block
|
|
ORB
|
Address of object rights block
|
|
PCB
|
Address of process control block
|
|
PHD
|
Address of process header
|
|
PSB
|
Address of persona security block
|
Other SDA commands, such as SHOW DEVICE and SHOW CLUSTER, predefine
additional symbols.
SDA Symbol Initialization
On initialization, SDA reads the universal symbols defined by
SYS$BASE_IMAGE.EXE. For every procedure descriptor address symbol
found, a routine address symbol is created (with _C appended to the
symbol name).
SDA then reads the object file REQSYSDEF.STB. This file contains data
structure definitions that are required for SDA to run correctly. It
uses these symbols to access some of the data structures in the crash
dump file or on the running system.
Finally, SDA initializes the process registers defined in Table 2-7
and executes a SET CPU command, defining the symbols as well.
Use of SDA Symbols
There are two major uses of the address type symbols. First, the
EXAMINE command employs them to find the value of a known symbol. For
example, EXAMINE CTL$GL_PCB finds the PCB for the current process.
Then, certain SDA commands (such as EXAMINE, SHOW STACK, and FORMAT)
use them to symbolize addresses when generating output.
When the code for one of these commands needs a symbol for an address,
it calls the SDA symbolize routine. The symbolize routine tries to find
the symbol in the symbol table whose address is closest to, but not
greater than the requested address. This means, for any given address,
the routine may return a symbol of the form symbol_name+offset. If,
however, the offset is greater than 0FFF16, it fails to find
a symbol for the address.
As a last resort, the symbolize routine checks to see if this address
falls within a known memory range. Currently, the only known memory
ranges are those used by the OpenVMS Alpha executive images and those
used by active images in a process. SDA searches through the executive
loaded image list (LDRIMG data structure) to see if the address falls
within any of the image sections. If SDA does find a match, it returns
one of the following types of symbols:
executive_image_name+offset
activated_image_name+offset
The offset is the same as the image offset as defined in the map file.
The constants in the SDA symbol table are usually used to display a
data structure with the FORMAT command. For example, the PHD offsets
are defined in SYSDEF.STB; you can display all the fields of the PHD by
entering the following commands:
SDA> READ SDA$READ_DIR:SYSDEF.STB

SDA> FORMAT/TYPE=PHD phd_address
|
Symbols and Address Resolution
In OpenVMS Alpha, executive and user images are loaded into dynamically
assigned address space. To help you associate a particular virtual
address with the image whose code has been loaded at that address, SDA
provides several features:
- The SHOW EXECUTIVE command
- The symbolization of addresses, described in the previous section
- The READ command
- The SHOW PROCESS command with the /IMAGES qualifier
- The MAP command
The OpenVMS Alpha executive consists of two base images,
SYS$BASE_IMAGE.EXE and SYS$PUBLIC_VECTORS.EXE, and a number of other
separately loadable images. Some of these images are loaded on all
systems, while others support features unique to particular system
configurations. Executive images are mapped into system space during
system initialization.
By default, a typical executive image is not mapped at contiguous
virtual addresses. Instead, its nonpageable image sections are loaded
into a reserved set of pages with other executive images' nonpageable
sections. The pageable sections of a typical executive image are mapped
contiguously into a different part of system space. An image mapped in
this manner is said to be sliced. A particular system
may have system parameters defined that disable executive image slicing
altogether.
Each executive image is described by a data structure called a
loadable image data block (LDRIMG). The LDRIMG
specifies whether the image has been sliced. If the image is sliced,
the LDRIMG indicates the beginning of each image section and the size
of each section. All the LDRIMGs are linked together in a list that SDA
scans to determine what images have been loaded and into what addresses
they have been mapped. The SHOW EXECUTIVE command displays a list of
all images that are included in the OpenVMS Alpha executive.
Each executive image is a shareable image whose universal symbols are
defined in the SYS$BASE_IMAGE.EXE symbol vector. On initialization, SDA
reads this symbol vector and adds its universal symbols to the SDA
symbol table.
Executive image .STB files define additional symbols within an
executive image that are not defined as universal symbols and thus are
not in the SYS$BASE_IMAGE.EXE symbol vector (see Sources for SDA Symbols
in this section). You can enter a READ/EXECUTIVE command to read
symbols defined in all executive image .STB files into the SDA symbol
table, or a READ/IMAGE filespec command to read the .STB for a
specified image only.
To obtain a display of all images mapped within a process, execute a
SHOW PROCESS/IMAGE command. See the description of the SHOW PROCESS
command for additional information about displaying the hardware and
software context of a process.
You can also identify the image name and offset that correspond to a
specified address with the MAP command. With the information obtained
from the MAP command, you can then examine the image map to locate the
source module and program section offset corresponding to an address.
2.6.3 SDA Display Mode
Some SDA commands produce more output than will fit on one screen. In
this situation, SDA enters display mode, and outputs
the screen overflow prompt at the bottom of the screen:
Press RETURN for more.
SDA>
|
If the RETURN key is pressed, SDA will continue the output of the
command it was processing. If an EXIT command is entered, SDA will
leave display mode, abort the command it was processing and output a
regular SDA prompt. If any other command is entered, SDA will leave
display mode, abort the command it was processing, and begin processing
the new command.
SDA will leave display mode once a continued command completes.
2.7 Investigating System Failures
This section discusses how the operating system handles internal
errors, and suggests procedures that can help you determine the causes
of these errors. It illustrates, through detailed analysis of a sample
system failure, how SDA helps you find the causes of operating system
problems.
For a complete description of the commands discussed in the sections
that follow, refer to Chapter 4 and Chapter 5 of this document,
where all the SDA and CLUE commands are presented in alphabetical order.
2.7.1 General Procedure for Analyzing System Failures
When the operating system detects an internal error so severe that
normal operation cannot continue, it signals a condition known as a
fatal bugcheck and shuts itself down. A specific bugcheck code
describes each fatal bugcheck.
To resolve the problem, you must find the reason for the bugcheck. Many
failures are caused by errors in user-written device drivers or other
privileged code not supplied by Compaq. To identify and correct these
errors, you need a listing of the code in question.
Occasionally, a system failure is the result of a hardware failure or
an error in code supplied by Compaq. A hardware failure requires the
attention of Compaq Services. To diagnose an error in code supplied by
Compaq, you need listings of that code, which are available from Compaq.
Start the search for the error by analyzing the CLUE list file that was
created by default when the system failed. This file contains an
overview of the system failure, which can assist you in finding the
line of code that signaled the bugcheck. CLUE CRASH displays the
content of the program counter (PC) in the list file. The content of
the PC is the address of the next instruction after the instruction
that signaled the bugcheck.
However, some bugchecks are caused by unexpected exceptions. In such
cases, the address of the instruction that caused the
exception is more informative than the address of the instruction that
signaled the bugcheck. The address of the instruction that caused the
exception is located on the stack. You can obtain this address either
by using the SHOW STACK command to display the contents of the stack or
by using the CLUE CRASH command to display the system state at time of
exception. See Section 2.7.2 for information on how to proceed for
several types of bugchecks.
Once you have found the address of the instruction that caused the
bugcheck or exception, find the module in which the failing instruction
resides. Use the MAP command to determine whether
the instruction is part of a device driver or another executive image.
Alternatively, the SHOW EXECUTIVE command shows the location and size
of each of the images that make up the OpenVMS Alpha executive.
If the instruction that caused the bugcheck is not part of a driver or
executive image, examine the linker's map of the module or modules you
are debugging to determine whether the instruction that caused the
bugcheck is in your program.
To determine the general cause of the system failure, examine the code
that signaled the bugcheck or the instruction that caused the exception.
2.7.2 Fatal Bugcheck Conditions
There are many possible conditions that can cause OpenVMS Alpha to
issue a bugcheck. Normally, these occasions are rare. When they do
occur, they are often fatal exceptions or illegal page faults occurring
within privileged code. This section describes the symptoms of several
common bugchecks. A discussion of other exceptions and condition
handling in general appears in the OpenVMS Programming Concepts Manual.
An exception is fatal when it occurs while either of the following
conditions exists:
- The process is executing above IPL 2 (IPL$_ASTDEL).
- The process is executing in a privileged (kernel or executive)
processor access mode and has not declared a condition handler to deal
with the exception.
When the system fails, the operating system reports the approximate
cause of the system failure on the console terminal. SDA displays a
similar message when you issue a SHOW CRASH command. For instance, for
a fatal exception, SDA can display one of these messages:
FATALEXCPT, Fatal executive or kernel mode exception

INVEXCEPTN, Exception while above ASTDEL

SSRVEXCEPT, Unexpected system service exception

UNXSIGNAL, Unexpected signal name in ACP
|
When a FATALEXCPT, INVEXCEPTN, SSRVEXCEPT, or UNXSIGNAL bugcheck
occurs, two argument lists, known as the mechanism and signal arrays,
are placed on the stack.
Section 2.7.2.1 to Section 2.7.2.4 describe these arrays and related data
structures, and Section 2.7.2.5 shows example output from SDA for an
SSRVEXCEPT bugcheck.
A page fault is illegal when it occurs while the interrupt priority
level (IPL) is greater than 2 (IPL$_ASTDEL). When OpenVMS Alpha fails
because of an illegal page fault, it displays the following message on
the console terminal:
PGFIPLHI, Page fault with IPL too high
|
Section 2.7.2.6 describes the stack contents when an illegal page fault
occurs.
2.7.2.1 Mechanism Array
Figure 2-1 illustrates the mechanism array, which is
made up entirely of quadwords. The first quadword of this array
indicates the number of quadwords in this array; this value is always
2C16. These quadwords are used by the procedures that search
for a condition handler and report exceptions.
Figure 2-1 Mechanism Array

Symbolic offsets into the mechanism array are defined as follows. The
SDA SHOW STACK command identifies the elements of the mechanism array
on the stack using these symbols.
| Offset |
Meaning |
|
CHF$IS_MCH_ARGS
|
Number of quadwords that follow. In a mechanism array, this value is
always 2C
16.
|
|
CHF$IS_MCH_FLAGS
|
Flag bits for related argument mechanism information.
|
|
CHF$PH_MCH_FRAME
|
Address of the FP (frame pointer) of the establisher's call frame.
|
|
CHF$IS_MCH_DEPTH
|
Depth of the OpenVMS Alpha search for a condition handler.
|
|
CHF$PH_MCH_DADDR
|
Address of the handler data quadword, if the exception handler data
field is present.
|
|
CHF$PH_MCH_ESF_ADDR
|
Address of the exception stack frame (see Figure 2-4).
|
|
CHF$PH_MCH_SIG_ADDR
|
Address of the signal array (see Figure 2-2).
|
|
CHF$IH_MCH_SAVRnn
|
Contents of the saved integer registers at the time of the exception.
The following registers are saved: R0, R1, and R16 to R28 inclusive.
|
|
CHF$FH_MCH_SAVFnn
|
If the process was using floating point, contents of the saved
floating-point registers at the time of the exception. The following
registers are saved: F0, F1, and F10 to F30 inclusive.
|
|
CHF$PH_MCH_SIG64_ADDR
|
Address of the 64-bit signal array (see Figure 2-3).
|
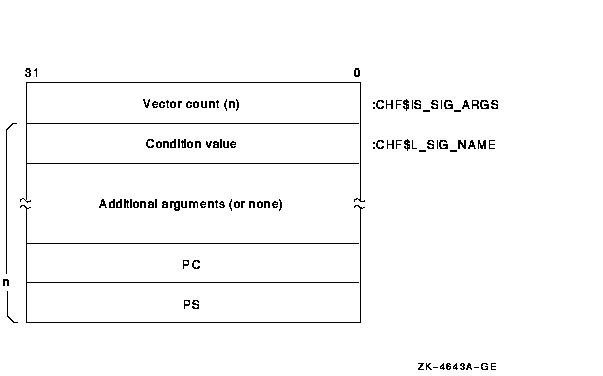
2.7.2.2 Signal Array
The signal array appears somewhat further down the
stack. This array comprises all longwords so that the structure is VAX
compatible. A signal array describes the exception that occurred. It
contains an argument count, the exception code, zero or more exception
parameters, the PC, and the PS. Therefore, the size of a signal array
can vary from exception to exception. Although there are several
possible exception conditions, access violations are most common.
Figure 2-2 shows the signal array for an access violation.
Figure 2-2 Signal Array

For access violations, the signal array is set up as follows:
| Value |
Meaning |
|
Vector list length
|
Number of longwords that follow. For access violations, this value is
always 5.
|
|
Condition value
|
Exception code. The value 0C
16 represents an access violation. You can identify the
exception code by using the SDA command EVALUATE/CONDITION_VALUE or
SHOW CRASH.
|
|
Additional arguments
|
These can include a reason mask and a virtual address.
In the longword mask if bit 0 of the longword is set, the failing
instruction (at the PC saved below) caused a length violation. If bit 1
is set, it referred to a location whose page table entry is in a
"no access" page. Bit 2 indicates the type of access used by
the failing instruction: it is set for write and modify operations and
clear for read operations.
The virtual address represents the low-order 32 bits of the virtual
address that the failing instruction tried to reference.
|
|
PC
|
PC whose execution resulted in the exception.
|
|
PS
|
PS at the time of the exception.
|
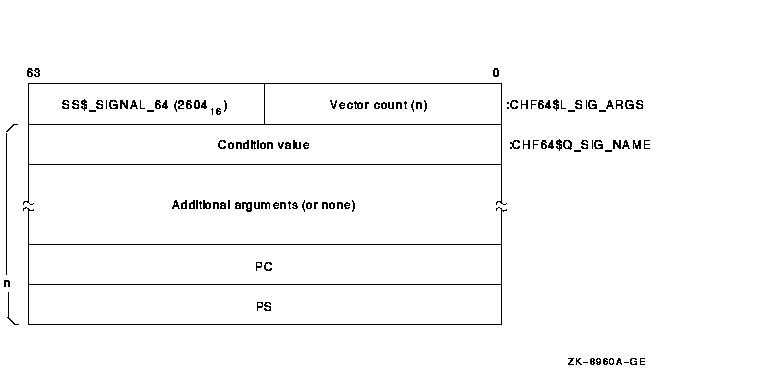
2.7.2.3 64-Bit Signal Array
The 64-bit signal array also appears further down the
stack. This array comprises all quadwords and is not VAX compatible. It
contains the same data as the signal array, and Figure 2-3 shows the
64-bit signal array for an access violation. The SDA SHOW STACK command
uses the CHF64$ symbols listed in the figure to identify the 64-bit
signal array on the stack.
Figure 2-3 64-Bit Signal Array

For access violations, the 64-bit signal array is set up as follows:
| Value |
Meaning |
|
Vector list length
|
Number of quadwords that follow. For access violations, this value is
always 5.
|
|
Condition value
|
Exception code. The value 0C
16 represents an access violation. You can identify the
exception code by using the SDA command EVALUATE/CONDITION_VALUE or
SHOW CRASH.
|
|
Additional arguments
|
These can include a reason mask and a virtual address.
In the quadword mask if bit 0 of the quadword is set, the failing
instruction (at the PC saved below) caused a length violation. If bit 1
is set, it referred to a location whose page table entry is in a
"no access" page. Bit 2 indicates the type of access used by
the failing instruction: it is set for write and modify operations and
clear for read operations.
|
|
PC
|
PC whose execution resulted in the exception.
|
|
PS
|
PS at the time of the exception.
|
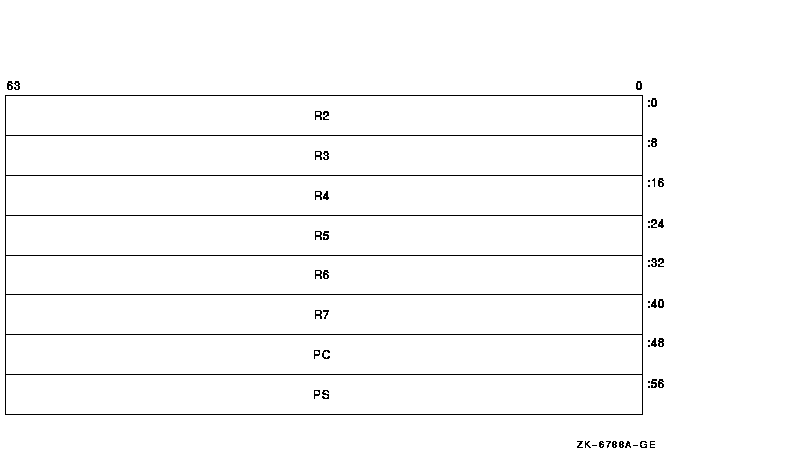
2.7.2.4 Exception Stack Frame
Figure 2-4 illustrates the exception stack frame, which comprises all
quadwords.
Figure 2-4 Exception Stack Frame

The values contained in the exception stack frame are defined as
follows:
Table 2-8 Exception Stack Frame Values
| Value |
Contents |
|
INTSTK$Q_R2
|
Contents of R2 at the time of the exception
|
|
INTSTK$Q_R3
|
Contents of R3 at the time of the exception
|
|
INTSTK$Q_R4
|
Contents of R4 at the time of the exception
|
|
INTSTK$Q_R5
|
Contents of R5 at the time of the exception
|
|
INTSTK$Q_R6
|
Contents of R6 at the time of the exception
|
|
INTSTK$Q_R7
|
Contents of R7 at the time of the exception
|
|
INTSTK$Q_PC
|
PC whose execution resulted in the exception
|
|
INTSTK$Q_PS
|
PS at the time of the exception (except high-order bits)
|
The SDA SHOW STACK command identifies the elements of the exception
stack frame on the stack using these symbols.
2.7.2.5 SSRVEXCEPT Example
If OpenVMS Alpha encounters a fatal exception, you can find the code
that signaled it by examining the PC in the signal array. Use the SHOW
CRASH or CLUE CRASH command to display the PC and the instruction
stream around the PC to locate the exception.
The following display shows the SDA output in response to the SHOW
CRASH and SHOW STACK commands for an SSRVEXCEPT bugcheck. It
illustrates the mechanism array, signal arrays, and the exception stack
frame previously described.
OpenVMS (TM) Alpha system dump analyzer
...analyzing a selective memory dump...

Dump taken on 30-AUG-2000 13:13:46.83
SSRVEXCEPT, Unexpected system service exception

SDA>  SHOW CRASH
Time of system crash: 30-AUG-1996 13:13:46.83


Version of system: OpenVMS (TM) Alpha Operating System, Version V7.3

System Version Major ID/Minor ID: 3/0


System type: DEC 3000 Model 400

Crash CPU ID/Primary CPU ID:  00/00

Bitmask of CPUs active/available:  00000001/00000001


CPU bugcheck codes:
        CPU 00 -- SSRVEXCEPT, Unexpected system service exception

System State at Time of Exception
---------------------------------
Exception Frame:
----------------
        R2  = 00000000.00000003
        R3  = FFFFFFFF.80C63460  EXCEPTION_MON_NPRW+06A60
        R4  = FFFFFFFF.80D12740  PCB
        R5  = 00000000.000000C8
        R6  = 00000000.00030038
        R7  = 00000000.7FFA1FC0
        PC  = 00000000.00030078
        PS  = 00000000.00000003

         00000000.00030068:     STQ             R27,(SP)
         00000000.0003006C:     BIS             R31,SP,FP
         00000000.00030070:     STQ             R26,#X0010(SP)
         00000000.00030074:     LDA             R28,(R31)
   PC => 00000000.00030078:     LDL             R28,(R28)
         00000000.0003007C:     BEQ             R28,#X000007
         00000000.00030080:     LDQ             R26,#XFFE8(R27)
         00000000.00030084:     BIS             R31,R26,R0
         00000000.00030088:     BIS             R31,FP,SP

   PS =>
         MBZ SPAL      MBZ    IPL VMM MBZ CURMOD INT PRVMOD
         0   00   00000000000 00  0   0   KERN   0   USER


Signal Array
------------
        Length = 00000005
        Type   = 0000000C
        Arg    = 00000000.00010000
        Arg    = 00000000.00000000
        Arg    = 00000000.00030078
        Arg    = 00000000.00000003
%SYSTEM-F-ACCVIO, access violation, reason mask=00, virtual address=0000000000000000,
   PC=0000000000030078, PS=00000003

Saved Scratch Registers in Mechanism Array
------------------------------------------
R0   = 00000000.00020000  R1   = 00000000.00000000  R16  = 00000000.00020004
R17  = 00000000.00010050  R18  = FFFFFFFF.FFFFFFFF  R19  = 00000000.00000000
R20  = 00000000.7FFA1F50  R21  = 00000000.00000000  R22  = 00000000.00010050
R23  = 00000000.00000000  R24  = 00000000.00010051  R25  = 00000000.00000000
R26  = FFFFFFFF.8010ACA4  R27  = 00000000.00010050  R28  = 00000000.00000000

CPU 00 Processor crash information
----------------------------------


CPU 00 reason for Bugcheck: SSRVEXCEPT, Unexpected system service exception


Process currently executing on this CPU: SYSTEM


Current image file: $31$DKB0:[SYS0.][SYSMGR]X.EXE;1


Current IPL: 0  (decimal)


CPU database address:  80D0E000


CPUs Capabilities:    PRIMARY,QUORUM,RUN

General registers:

R0   = 00000000.00000000  R1   = 00000000.7FFA1EB8  R2   = FFFFFFFF.80D0E6C0
R3   = FFFFFFFF.80C63460  R4   = FFFFFFFF.80D12740  R5   = 00000000.000000C8
R6   = 00000000.00030038  R7   = 00000000.7FFA1FC0  R8   = 00000000.7FFAC208
R9   = 00000000.7FFAC410  R10  = 00000000.7FFAD238  R11  = 00000000.7FFCE3E0
R12  = 00000000.00000000  R13  = FFFFFFFF.80C6EB60  R14  = 00000000.00000000
R15  = 00000000.009A79FD  R16  = 00000000.000003C4  R17  = 00000000.7FFA1D40
R18  = FFFFFFFF.80C05C38  R19  = 00000000.00000000  R20  = 00000000.7FFA1F50
R21  = 00000000.00000000  R22  = 00000000.00000001  R23  = 00000000.7FFF03C8
R24  = 00000000.7FFF0040  AI   = 00000000.00000003  RA   = FFFFFFFF.82A21080
PV   = FFFFFFFF.829CF010  R28  = FFFFFFFF.8004B6DC  FP   = 00000000.7FFA1CA0
PC   = FFFFFFFF.82A210B4  PS   = 18000000.00000000


Processor Internal Registers:


ASN  = 00000000.0000002F                     ASTSR/ASTEN =          0000000F
IPL  =          00000000  PCBB = 00000000.003FE080  PRBR = FFFFFFFF.80D0E000
PTBR = 00000000.00001136  SCBB = 00000000.000001DC  SISR = 00000000.00000000
VPTB = FFFFFFFC.00000000  FPCR = 00000000.00000000  MCES = 00000000.00000000

CPU 00 Processor crash information
----------------------------------


        KSP    = 00000000.7FFA1C98
        ESP    = 00000000.7FFA6000
        SSP    = 00000000.7FFAC100
        USP    = 00000000.7AFFBAD0

                No spinlocks currently owned by CPU 00


SDA> SHOW STACK
Current Operating Stack (KERNEL):
                       00000000.7FFA1C78    18000000.00000000
                       00000000.7FFA1C80    00000000.7FFA1CA0
                       00000000.7FFA1C88    00000000.00000000
                       00000000.7FFA1C90    00000000.7FFA1D40
                SP =>  00000000.7FFA1C98    00000000.00000000
                       00000000.7FFA1CA0    FFFFFFFF.829CF010  EXE$EXCPTN
                       00000000.7FFA1CA8    FFFFFFFF.82A2059C  EXCEPTION_MON_PRO+0259C
                       00000000.7FFA1CB0    00000000.00000000
                       00000000.7FFA1CB8    00000000.7FFA1CD0
                       00000000.7FFA1CC0    FFFFFFFF.829CEDA8  EXE$SET_PAGES_READ_ONLY+00948
                       00000000.7FFA1CC8    00000000.00000000
                       00000000.7FFA1CD0    FFFFFFFF.829CEDA8  EXE$SET_PAGES_READ_ONLY+00948
                       00000000.7FFA1CD8    00000000.00000000
                       00000000.7FFA1CE0    FFFFFFFF.82A1E930  EXE$CONTSIGNAL_C+001D0
                       00000000.7FFA1CE8    00000000.7FFA1F40
                       00000000.7FFA1CF0    FFFFFFFF.80C63780  EXE$ACVIOLAT
                       00000000.7FFA1CF8    00000000.7FFA1EB8
                       00000000.7FFA1D00    00000000.7FFA1D40
                       00000000.7FFA1D08    00000000.7FFA1F00
                       00000000.7FFA1D10    00000000.7FFA1F40
                       00000000.7FFA1D18    00000000.00000000
                       00000000.7FFA1D20    00000000.00000000
                       00000000.7FFA1D28    00000000.00020000  SYS$K_VERSION_04
                       00000000.7FFA1D30    00000005.00000250  BUG$_NETRCVPKT
                       00000000.7FFA1D38    829CE050.000008F8  BUG$_SEQ_NUM_OVF
CHF$IS_MCH_ARGS        00000000.7FFA1D40    00000000.0000002C
CHF$PH_MCH_FRAME       00000000.7FFA1D48    00000000.7AFFBAD0
CHF$IS_MCH_DEPTH       00000000.7FFA1D50    FFFFFFFF.FFFFFFFD
CHF$PH_MCH_DADDR       00000000.7FFA1D58    00000000.00000000
CHF$PH_MCH_ESF_ADDR    00000000.7FFA1D60    00000000.7FFA1F00
CHF$PH_MCH_SIG_ADDR    00000000.7FFA1D68    00000000.7FFA1EB8
CHF$IH_MCH_SAVR0       00000000.7FFA1D70    00000000.00020000  SYS$K_VERSION_04
CHF$IH_MCH_SAVR1       00000000.7FFA1D78    00000000.00000000
CHF$IH_MCH_SAVR16      00000000.7FFA1D80    00000000.00020004  UCB$M_LCL_VALID+00004
CHF$IH_MCH_SAVR17      00000000.7FFA1D88    00000000.00010050  SYS$K_VERSION_16+00010
CHF$IH_MCH_SAVR18      00000000.7FFA1D90    FFFFFFFF.FFFFFFFF
CHF$IH_MCH_SAVR19      00000000.7FFA1D98    00000000.00000000
CHF$IH_MCH_SAVR20      00000000.7FFA1DA0    00000000.7FFA1F50
CHF$IH_MCH_SAVR21      00000000.7FFA1DA8    00000000.00000000
CHF$IH_MCH_SAVR22      00000000.7FFA1DB0    00000000.00010050  SYS$K_VERSION_16+00010
CHF$IH_MCH_SAVR23      00000000.7FFA1DB8    00000000.00000000
CHF$IH_MCH_SAVR24      00000000.7FFA1DC0    00000000.00010051  SYS$K_VERSION_16+00011
CHF$IH_MCH_SAVR25      00000000.7FFA1DC8    00000000.00000000
CHF$IH_MCH_SAVR26      00000000.7FFA1DD0    FFFFFFFF.8010ACA4  AMAC$EMUL_CALL_NATIVE_C+000A4
CHF$IH_MCH_SAVR27      00000000.7FFA1DD8    00000000.00010050  SYS$K_VERSION_16+00010
CHF$IH_MCH_SAVR28      00000000.7FFA1DE0    00000000.00000000
                       00000000.7FFA1DE8    00000000.00000000
                       00000000.7FFA1DF0    00000000.00000000
                       00000000.7FFA1DF8    00000000.00000000
                       00000000.7FFA1E00    00000000.00000000
                       00000000.7FFA1E08    00000000.00000000
                       00000000.7FFA1E10    00000000.00000000
                       00000000.7FFA1E18    00000000.00000000
                       00000000.7FFA1E20    00000000.00000000
                       00000000.7FFA1E28    00000000.00000000
                       00000000.7FFA1E30    00000000.00000000
                       00000000.7FFA1E38    00000000.00000000
                       00000000.7FFA1E40    00000000.00000000
                       00000000.7FFA1E48    00000000.00000000
                       00000000.7FFA1E50    00000000.00000000
                       00000000.7FFA1E58    00000000.00000000
                       00000000.7FFA1E60    00000000.00000000
                       00000000.7FFA1E68    00000000.00000000
                       00000000.7FFA1E70    00000000.00000000
                       00000000.7FFA1E78    00000000.00000000
                       00000000.7FFA1E80    00000000.00000000
                       00000000.7FFA1E88    00000000.00000000
                       00000000.7FFA1E90    00000000.00000000
                       00000000.7FFA1E98    00000000.00000000
CHF$PH_MCH_SIG64_ADDR  00000000.7FFA1EA0    00000000.7FFA1ED0
                       00000000.7FFA1EA8    00000000.00000000
                       00000000.7FFA1EB0    00000000.7FFA1F50
                       00000000.7FFA1EB8    0000000C.00000005
                       00000000.7FFA1EC0    00000000.00010000  SYS$K_VERSION_07
                       00000000.7FFA1EC8    00000003.00030078  SYS$K_VERSION_01+00078
CHF$L_SIG_ARGS         00000000.7FFA1ED0    00002604.00000005  UCB$M_TEMPLATE+00604
CHF$L_SIG_ARG1         00000000.7FFA1ED8    00000000.0000000C
                       00000000.7FFA1EE0    00000000.00010000  SYS$K_VERSION_07
                       00000000.7FFA1EE8    00000000.00000000
                       00000000.7FFA1EF0    00000000.00030078  SYS$K_VERSION_01+00078
                       00000000.7FFA1EF8    00000000.00000003
INTSTK$Q_R2            00000000.7FFA1F00    00000000.00000003
INTSTK$Q_R3            00000000.7FFA1F08    FFFFFFFF.80C63460  EXCEPTION_MON_NPRW+06A60
INTSTK$Q_R4            00000000.7FFA1F10    FFFFFFFF.80D12740  PCB
INTSTK$Q_R5            00000000.7FFA1F18    00000000.000000C8
INTSTK$Q_R6            00000000.7FFA1F20    00000000.00030038  SYS$K_VERSION_01+00038
INTSTK$Q_R7            00000000.7FFA1F28    00000000.7FFA1FC0
INTSTK$Q_PC            00000000.7FFA1F30    00000000.00030078  SYS$K_VERSION_01+00078
INTSTK$Q_PS            00000000.7FFA1F38    00000000.00000003
Prev SP (7FFA1F40) ==> 00000000.7FFA1F40    00000000.00010050  SYS$K_VERSION_16+00010
                       00000000.7FFA1F48    00000000.00010000  SYS$K_VERSION_07
                       00000000.7FFA1F50    FFFFFFFF.8010ACA4  AMAC$EMUL_CALL_NATIVE_C+000A4
                       00000000.7FFA1F58    00000000.7FFA1F70
                       00000000.7FFA1F60    00000000.00000001
                       00000000.7FFA1F68    FFFFFFFF.800EE81C  RM_STD$DIRCACHE_BLKAST_C+005AC
                       00000000.7FFA1F70    FFFFFFFF.80C6EBA0  SCH$CHSEP+001E0
                       00000000.7FFA1F78    00000000.829CEDE8  EXE$SIGTORET
                       00000000.7FFA1F80    00010050.00000002  SYS$K_VERSION_16+00010
                       00000000.7FFA1F88    00000000.00020000  SYS$K_VERSION_04
                       00000000.7FFA1F90    00000000.00030000  SYS$K_VERSION_01
                       00000000.7FFA1F98    FFFFFFFF.800A4D64  EXCEPTION_MON_NPRO+00D64
                       00000000.7FFA1FA0    00000000.00000003
                       00000000.7FFA1FA8    FFFFFFFF.80D12740  PCB
                       00000000.7FFA1FB0    00000000.00010000  SYS$K_VERSION_07
                       00000000.7FFA1FB8    00000000.7AFFBAD0
                       00000000.7FFA1FC0    00000000.7FFCF880  MMG$IMGHDRBUF+00080
                       00000000.7FFA1FC8    00000000.7B0E9851
                       00000000.7FFA1FD0    00000000.7FFCF818  MMG$IMGHDRBUF+00018
                       00000000.7FFA1FD8    00000000.7FFCF938  MMG$IMGHDRBUF+00138
                       00000000.7FFA1FE0    00000000.7FFAC9F0
                       00000000.7FFA1FE8    00000000.7FFAC9F0
                       00000000.7FFA1FF0    FFFFFFFF.80000140  SYS$PUBLIC_VECTORS_NPRO+00140
                       00000000.7FFA1FF8    00000000.0000001B

   .
   .
   .
|
|

