 |
OpenVMS VAX System Dump Analyzer Utility Manual
7 SDA Command Format
The following sections describe the format of SDA commands and the
expressions you can use with SDA commands.
7.1 General Command Format
SDA uses a command format similar to that used by the DCL interpreter.
You issue commands in this general format:
command-name[/qualifier...] [parameter][/qualifier...] [!comment]
|
where:
|
command-name
|
Is an SDA command. Each command tells the utility to perform a
function. Commands can consist of one or more words, and can be
abbreviated to the number of characters that make the command unique.
For example, SH stands for SHOW and SE stands for SET.
|
|
/qualifier
|
Modifies the action of an SDA command. A qualifier is always preceded
by a slash (/). Several qualifiers can follow a single parameter or
command name, but a slash must precede each. You can abbreviate
qualifiers to the shortest string of characters that uniquely
identifies the qualifier.
|
|
parameter
|
Is the target of the command. For example, SHOW PROCESS RUSKIN tells
SDA to display the context of the process RUSKIN. The command EXAMINE
80104CD0;40 displays the contents of 40 bytes of memory, beginning with
location 80104CD0.
When you supply part of a file specification as a parameter, SDA
assumes default values for the omitted portions of the specification.
The default device SYS$DISK and default directory are those specified
in your most recent SET DEFAULT command. See the OpenVMS DCL Dictionary for a
description of the DCL command SET DEFAULT.
|
|
!comment
|
Consists of text that describes the command, but this text is not
actually part of the command. Comments are useful for documenting SDA
command procedures. When executing a command, SDA ignores the
exclamation point (!) and all characters that follow it on the same
line.
|
7.2 Expressions
You can use expressions as parameters for some SDA commands, such as
SEARCH and EXAMINE. To create expressions, you can use any of the
following elements:
- Numerals
- Radix operators
- Arithmetic and logical operators
- Precedence operators
- Symbols
The following sections describe elements other than numerals.
7.2.1 Radix Operators
Radix operators determine which numeric base SDA uses
to evaluate expressions. You can use one of three radix operators to
specify the radix of the numeric expression that follows the operator:
- ^X (hexadecimal)
- ^O (octal)
- ^D (decimal)
The default radix is hexadecimal. SDA displays hexadecimal numbers with
leading zeros and decimal numbers with leading spaces.
7.2.2 Arithmetic and Logical Operators
There are two types of arithmetic and logical operators, both of which
are listed in Table SDA-8.
- Unary operators affect the value of the expression
that follows them.
- Binary operators combine the operands that precede
and follow them.
In evaluating expressions containing binary operators, SDA performs
logical AND, OR, and XOR operations, and multiplication, division, and
arithmetic shifting before addition and subtraction. Note that the SDA
arithmetic operators perform integer arithmetic on 32-bit operands.
Table SDA-8 SDA Operators
| Operator |
Action |
| Unary Operators |
|
#
|
Performs a logical NOT of the expression
|
|
+
|
Makes the value of the expression positive
|
|
--
|
Makes the value of the expression negative
|
|
@
|
Evaluates the following expression as a virtual address, then uses the
contents of that address as value
|
|
G
|
Adds 80000000
16 to the value of the expression
1
|
|
H
|
Adds 7FFE0000
16 to the value of the expression
2
|
| Binary Operators |
|
+
|
Addition
|
|
--
|
Subtraction
|
|
*
|
Multiplication
|
|
&
|
Logical AND
|
|
|
|
Logical OR
|
|
\
|
Logical XOR
|
|
/
|
Division
3
|
|
@
|
Arithmetic shifting
|
1The unary operator G corresponds to the first virtual
address in system space. For example, the expression GD40 can be used
to represent the address 80000D4016.
2The unary operator H corresponds to a convenient base
address in the control region of a process (7FFE000016). You
can therefore refer to an address such as 7FFE2A6416 as
H2A64.
3In division, SDA truncates the quotient to an integer, if
necessary, and does not retain a remainder.
7.2.3 Precedence Operators
SDA uses parentheses as precedence operators.
Expressions enclosed in parentheses are evaluated first. SDA evaluates
nested parenthetical expressions from the innermost to the outermost
pairs of parentheses.
7.2.4 Symbols
Names of symbols can contain from 1 to 31 alphanumeric characters and
can include the dollar sign ($) and underscore (_) characters. Symbols
can take values from --7FFFFFFF16 to 7FFFFFFF16.
By default, SDA copies symbols into its symbol table from the files
SYS$SYSTEM:SYS.STB and SYS$SYSTEM:REQSYSDEF.STB. To add more symbols to
the symbol table, you can use the following SDA commands:
- READ---to add symbols from other symbol tables or object modules
- DEFINE---to create symbols and add them to the symbol table
In addition, SDA provides the symbols described in Table SDA-9.
Table SDA-9 SDA Symbols
| Symbol |
Meaning |
|
. (period)
|
Current location
|
|
2P_CDDB
|
Address of alternate CDDB for MSCP-served device
1
|
|
2P_UCB
|
Address of alternate UCB for dual-pathed device
1
|
|
AMB
|
Associated mailbox UCB pointer
1
|
|
AP
|
Argument pointer
2
|
|
CDDB
|
Address of class driver descriptor block for MSCP-served device
1
|
|
CLUSTRLOA
|
Base address of loadable VAXcluster code
|
|
CRB
|
Address of channel request block
1
|
|
DDB
|
Address of device data block
1
|
|
DDT
|
Address of driver dispatch table
1
|
|
nnDRIVER
|
Base address of a driver prologue table (DPT); such a symbol exists for
each loaded device driver in the system
3
|
|
ESP
|
Executive stack pointer
2
|
|
FP
|
Frame pointer
2
|
|
FPEMUL
|
Base address of the code that emulates floating-point instructions
|
|
G
|
80000000
16, the base address of system space
|
|
H
|
7FFE0000
16
|
|
IRP
|
Address of I/O request packet
1
|
|
JIB
|
Job information block
|
|
KSP
|
Kernel stack pointer
2
|
|
LNM
|
Address of logical name block for mailbox
1
|
|
MCHK
|
Address within loadable CPU-specific routines
|
|
MSCP
|
Address of loadable MSCP server code
|
|
ORB
|
Address of object rights block
1
|
|
P0BR
|
Base register for the program region (P0)
2
|
|
P0LR
|
Length register for the program region (P0)
2
|
|
P1BR
|
Base register for the control region (P1)
2
|
|
P1LR
|
Length register for the control region (P1)
2
|
|
PC
|
Program counter
2
|
|
PCB
|
Process control block
|
|
PDT
|
Address of port descriptor table
1
|
|
PHD
|
Process header
|
|
PSL
|
Processor status longword
2
|
|
R0 through R11
|
General registers
2
|
|
RMS
|
Base address of the RMS image
|
|
RWAITCNT
|
Resource wait count for MSCP-served device
1
|
|
SB
|
Address of system block
1
|
|
SCSLOA
|
Base address of loadable common SCS services
|
|
SP
|
Current stack pointer of a process
2
|
|
SSP
|
Supervisor stack pointer
2
|
|
SYSLOA
|
Base address of loadable processor-specific system code
|
|
TMSCP
|
Address of loadable TMSCP server code
|
|
UCB
|
Address of unit control block
1
|
|
USP
|
User stack pointer
2
|
|
VCB
|
Address of volume control block for mounted device
1
|
1The SHOW DEVICE command defines this symbol, if
appropriate, to represent information pertinent to the last displayed
device unit. See the description of the SHOW DEVICE command for
additional information.
2The value of those symbols representing the current SDA
process context changes whenever you issue a command that changes the
context (see Section 4). These symbols include the general-purpose
registers (R0 through R11, AP, FP, PC, and SP); the per-process stack
pointers (USP, SSP, KSP); the page table base and length registers
(P0BR, P0LR, P1BR, and P1LR); and the processor status longword (PSL).
3The notation nn within the symbol
nnDRIVER represents a 2-letter, generic device/controller name
(for example, LPDRIVER).
When SDA displays an address, it displays that address both in
hexadecimal and as a symbol, if possible. If the address is within
FFF16 of the value of a symbol, SDA displays the symbol plus
the offset from the value of that symbol to the address. If more than
one symbol's value is within FFF16 of the address, SDA
displays the symbol whose value is the closest. If no symbols have
values within FFF16 of the address, SDA displays no symbol.
(For an example, see the description of the SHOW STACK command.)
8 Investigating System Failures
This section discusses how the operating system handles internal errors
and suggests procedures that can aid you in determining the causes of
these errors. To conclude, it illustrates, through detailed analysis of
a sample system failure, how SDA helps you find the causes of operating
system problems.
For a complete description of the commands discussed in the sections
that follow, refer to the SDA Commands section.
8.1 General Procedure for Analyzing System Failures
When the operating system detects an internal error so severe that
normal operation cannot continue, it signals a condition known as a
fatal bugcheck and shuts itself down. A specific bugcheck code
describes each such error.
To resolve the problem, you must find the reason for the bugcheck. Most
failures are caused by errors in user-written device drivers or other
privileged code not supplied by Compaq. To identify and correct these
errors, you need a listing of the code in question.
Occasionally, a system failure is the result of a hardware failure or
an error in code supplied by Compaq. A hardware failure requires the
attention of Compaq Services. To diagnose an error in code supplied by
Compaq, you need listings of that code, which are available from Compaq
on CDROM.
Following are the steps you can take to diagnose an error:
- Start the search for the error by locating the line of code that
signaled the bugcheck. Invoke SDA and use the SHOW CRASH command to
display the contents of the program counter (PC). The PC contains the
address of the instruction immediately following the instruction that
signaled the bugcheck.
- Use the SHOW STACK command to display the contents of the stack.
The PC often contains an address in the exception handler. This address
is the address of the instruction that signaled the bugcheck, but not
the address of the instruction that caused it. In this case, the
address of the instruction that caused the bugcheck is located on the
stack. See Section 8.2 for information about how to proceed for
several types of bugchecks.
- Once you have found the address of the instruction that caused the
bugcheck, you need to find the module in which the failing instruction
resides. Use the SHOW DEVICE command to determine whether the
instruction is part of a device driver.
- If the module is not part of a driver, examine the linker's map of
the module or modules you are debugging to determine whether the
instruction that caused the bugcheck is in your programs.
- If the module is not within a driver or other code supplied by
Compaq, perform the following steps:
- Issue the following SDA command:
This command shows the location and size of each of the loadable
images that make up the executive.
- Compare the suspected address with the addresses of the system
images.
- If the address is within one of the images, issue the following
command:
SDA> READ/EXECUTIVE SYS$LOADABLE_IMAGES:
|
This command loads the symbols that define locations within the
loadable portion of the executive. (READ/EXECUTIVE is the default
display.)
- Examine the failing address by issuing the following command:
SDA then displays the address in the PC as an offset from the
nearest global symbol. This symbol might be the module's starting
address, although it is possible that the code you are examining might
not be in the module whose name is displayed.
- To determine the general cause of the system failure, examine the
code that signaled the bugcheck.
8.2 Fatal Bugcheck Conditions
Several conditions result in a bugcheck. Normally, these occasions are
rare. When they do occur, it is likely that they are in the nature of a
fatal exception or an illegal page fault occurring within privileged
code. This section describes the symptoms of these bugchecks. A
discussion of other exceptions and condition handling in general
appears in the OpenVMS System Services Reference Manual.
8.2.1 Fatal Exceptions
An exception is fatal when it occurs while the following conditions
exist:
- The process is using the interrupt stack.
- The process is executing above IPL 2 (IPL$_ASTDEL).
- The process is executing in a privileged (kernel or executive)
processor access mode and has not declared a condition handler to deal
with the exception.
When the system fails, the operating system reports the approximate
cause of the failure on the console terminal. SDA displays a similar
message when you issue a SHOW CRASH command. For instance, for a fatal
exception, SDA can display one of these messages:
FATALEXCPT, Fatal executive or kernel mode exception

INVEXCEPTN, Exception while above ASTDEL or on interrupt stack

SSRVEXCEPT, Unexpected system service exception
|
Although several exception conditions are possible, access violations
are the most common. When the hardware detects an access violation,
information useful in finding the cause of the violation is pushed onto
either the kernel stack or the interrupt stack. If the access violation
occurs when the hardware is using the interrupt stack, this information
appears on the interrupt stack.
The INVEXCEPTN, SSRVEXCEPT, and FATALEXCPT bugchecks place two argument
lists, known as the mechanism and signal arrays, on the stack.
The SSRVEXCEPT and FATALEXCPT bugchecks push an additional argument
list onto the stack above these arrays; INVEXCEPTN does not. This
pointer array (see Figure SDA-1) contains the number 2 in its first
longword, indicating that the following two longwords complete the
array. The second longword contains the stack address of the
signal array; the third contains the stack address of
the mechanism array.
Figure SDA-1 Pointer Argument List on the Stack

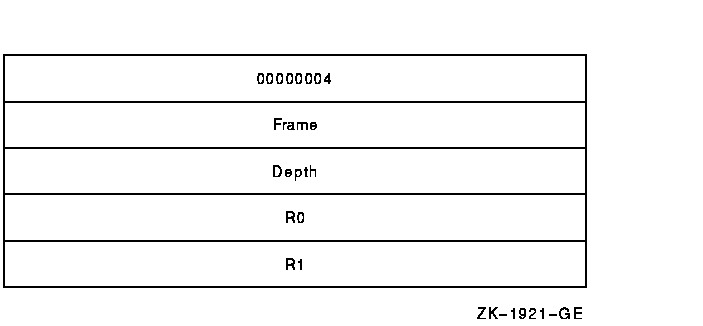
The first longword of the mechanism array (see
Figure SDA-2) contains a 4, indicating that the four subsequent
longwords complete the array. These four longwords are used by the
procedures that search for a condition handler and report exceptions.
Figure SDA-2 Mechanism Array

The values in the mechanism array are the following:
| Value |
Meaning |
|
00000004
|
Number of longwords that follow. In a mechanism array, this value is
always 4.
|
|
Frame
|
Address of the FP (frame pointer) of the establisher's call frame.
|
|
Depth
|
Depth of the search for a condition handler.
|
|
R0
|
Contents of R0 at the time of the exception.
|
|
R1
|
Contents of R1 at the time of the exception.
|
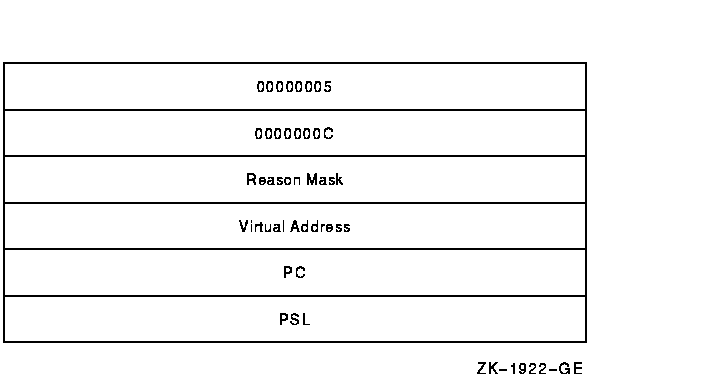
The signal array (see Figure SDA-3) appears somewhat
further down the stack. A signal array contains the exception code,
zero or more exception parameters, the PC, and the PSL. The size of a
signal array can thus vary from exception to exception.
Figure SDA-3 Signal Array

For access violations, the signal array is set up as follows:
| Value |
Meaning |
|
00000005
|
Number of longwords that follow. For access violations, this value is
always 5.
|
|
0000000C
|
Exception code. The value 0C
16 represents an access violation. You can identify the
exception code by using the SDA command EVALUATE/CONDITION.
|
|
Reason mask
|
Longword mask. If bit 0 of this longword is set, the failing
instruction (at the PC saved below) caused a length violation. If bit 1
is set, it referred to a location whose page table entry is in a
"no access" page. Bit 2 indicates the type of access used by
the failing instruction: it is set for write and modify operations and
clear for read operations.
|
|
Virtual address
|
Virtual address that the failing instruction tried to reference.
|
|
PC
|
PC whose execution resulted in the exception.
|
|
PSL
|
PSL at the time of the exception.
|
In the case of a fatal exception, you can find the code that signaled
it by examining the PC in the signal array. Use the SHOW STACK command
to display the stack in use when the failure occurred and then locate
the mechanism and signal arrays. Once you obtain the PC, which points
to the instruction that signaled the exception, you can identify the
module where the instruction is located by following the instructions
in Section 9.3.
|


