HP OpenVMS Systems Documentation |
DECamds User's Guide
1.3.2 Customizing Security FilesSecurity files define which Data Analyzers can access data on nodes that have a Data Provider. The security files let you group nodes according to specific criteria.
Installing DECamds initially assigns all nodes to one group. Each node that is assigned to a group is listed under the group name heading in the System Overview window. Consider the following items when you set up customized groups:
1.3.2.1 Setting Up Node GroupsAssign nodes in a cluster to the same group. To assign a node to a group, perform the following steps on each Data Provider node that is to be part of the group:
For more information about the other logical names in
AMDS$LOGICALS.COM, see Appendix B.
The Data Provider stores access security triplets in a file called AMDS$DRIVER_ACCESS.DAT, which indicates the Data Analyzer nodes that are allowed to request that data be provided. If a Data Analyzer node is not listed in the file, access is denied. All Data Provider nodes in Group FINANCE have the following AMDS$DRIVER_ACCESS.DAT file:
All Data Provider nodes in Group DEVELOPMENT have the following AMDS$DRIVER_ACCESS.DAT file:
AMDS$CONSOLE_ACCESS.DAT file for a Data Analyzer For a Data Analyzer to access information on any node in Groups FINANCE or DEVELOPMENT, the following access security triplets must be listed in the Data Analyzer node's AMDS$CONSOLE_ACCESS.DAT file:
After you modify the AMDS$CONSOLE_ACCESS.DAT security file, restart the
Data Analyzer with the AVAIL command to use the changes. For more
information about starting DECamds, see Chapter 2.
You can restrict write access for certain users by performing the following steps:
The next time the user starts DECamds, the new security file will be
found in their SYS$LOGIN directory and will be used. The security file
found in AMDS$SYSTEM will not be read.
The logical names shown in Table 1-3 control the sending of messages to OPCOM and are defined in the AMDS$LOGICALS.COM file.
To use the changes, restart the Data Analyzer with the following command on each system or use the System Management utility (SYSMAN) to run the command on all systems within the OpenVMS Cluster:
1.3.4 Setting Broadcast Intervals for Node Availability MessagesAvailability messages are broadcast by the Data Provider on nodes at regular intervals until a node establishes a link with the Data Analyzer. After a link has been established, the interval varies depending on the amount of data collection (and other factors) occurring between nodes. You can modify the logical names in the AMDS$LOGICALS.COM file (shown in Table 1-4) to change the broadcast availability intervals.
To use the changes, restart the Data Analyzer with the following command on each system or by using SYSMAN to run the command on all systems within the OpenVMS Cluster:
Chapter 2
|
If you have a recent version of DECamds or if you have Availability Manager installed, you must use the following command to invoke DECamds:
|
/CONFIGURE
Specifies the directories from which input files are read. This can be a search list of directories or a logical defining a search list of directories./LOG_DIRECTORY
Specifies the directory to which log files are written. Output files can be directed to the null device, NLA0:./GROUP
A comma-separated list of the groups of Data Provider nodes that you want the Data Analyzer to access.
If you have not already set up a group hierarchy of nodes during DECamds installation, refer to Section 1.3.2.1 for information about setting up node groups. |
The following examples of commands start DECamds with input files read first from SYS$LOGIN, and then from AMDS$SYSTEM (if the files are not found in SYS$LOGIN). All output files are written to the SYS$LOGIN directory. Only data from the group you enter (such as KUDOS) is collected.
$ DEFINE/JOB AMDS$CONFIG SYS$LOGIN,AMDS$SYSTEM $ AVAIL/CONFIGURE=AMDS$CONFIG/LOG_DIRECTORY=SYS$LOGIN/GROUP=(KUDOS) |
When DECamds starts, it displays the System Overview and Event Log windows.
To obtain help about DECamds, choose a menu item from the Help menu.
2.2 Using the System Overview Window
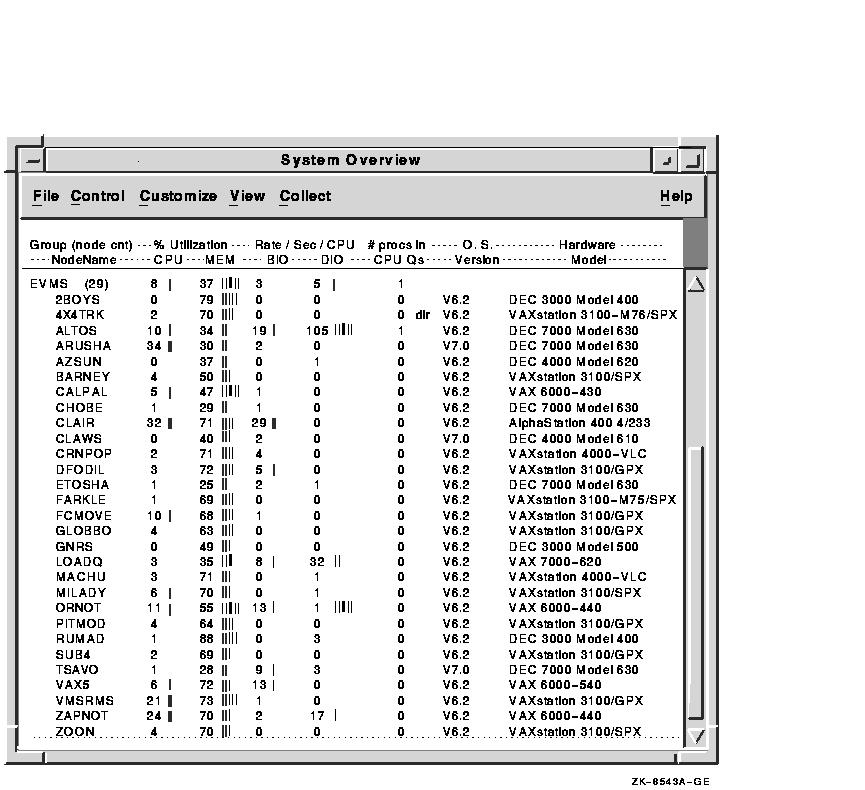
The System Overview window allows you to focus on resource usage activity at a high level and to display more specific data when necessary. The System Overview window displays CPU, memory, I/O data, number of processes in CPU queues, operating system version, and hardware model for each node and group DECamds recognizes.
Figure 2-1 shows a sample System Overview window displaying the nodes that DECamds can reach and is monitoring.
Figure 2-1 System Overview Window

The System Overview window contains two kinds of information:
Table 2-1 explains the fields displayed in the System Overview window.
| Field | Description |
|---|---|
| Group | Displays the group names in alphabetical order and the number of nodes recognized by DECamds. A group is a defined set of nodes that appear together in the System Overview window. A group can be defined by type of hardware, physical location, function, or OpenVMS Cluster alias. |
| NodeName | Displays the name of the node in a node row. |
| CPU (CPU usage) |
In a group row, displays the average of the percentage of CPU time used
by all processors weighted toward the present.
In a node row, displays the percentage of CPU time used by all processes on the node, expressed as an exponential average, weighted toward the present. On Symmetric Multiprocessing (SMP) nodes, rates for CPU time are added and divided by the number of CPUs. |
| MEM (Memory rate) |
In a group row, displays the average of the sampled values (over time)
for all processes on all nodes in a group.
In a node row, displays the percent of space in physical memory that all processes on the node are currently occupying. The value represents 100 percent minus the amount of free memory. |
| BIO (Buffered I/O rate) |
In a group row, displays the average of BIO operations of all processes
on all nodes.
In a node row, displays the BIO rate for all processes on the node across the number of CPUs. |
| DIO (Direct I/O usage) |
In a group row, displays the average of DIO operations of all processes
on all nodes.
In a node row, displays the DIO rate for all processes on the node. |
| # procs in CPU Qs (Number of processes in CPU queues) | Represents the number of processes the Node Summary data collection found in the COM, COMO, MWAIT, and PWAIT CPU queues. |
| O.S. Version (Version of the operating system) | Lists the currently loaded version of OpenVMS on the node being monitored (not the node doing the monitoring). |
| Hardware Model | Lists the hardware model of the node being monitored. |
A percentage of a used resource is shown both by number and a dynamic status bar. For group rows, the values are averaged for all nodes in the group when node summary data collection is active. (Node summary data collection is active by default on DECamds startup.)
Resource availability problems are indicated by highlighting. When an event occurs, DECamds highlights the status bar that represents the resource. Highlighting is shown in red on color monitors, by default; it is bold on monochrome monitors. You can change the highlight color. (See Chapter 5 for more information.)
When data appears dimmed, the data is more than 60 seconds old due to a user action that stopped node summary data collection. When the data is updated, the display returns to normal resolution.
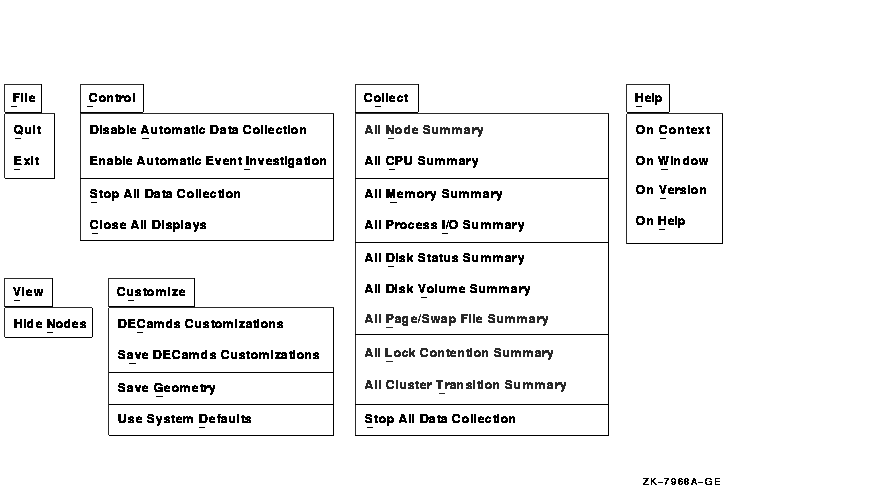
Figure 2-2 shows the System Overview window options. Note that on the View menu, the Hide Nodes item toggles with Show Nodes; on the Control menu, the Disable menu choices toggle with Enable choices.
Figure 2-2 System Overview Window Menus

Use the View menu to display group or group and node status in the System Overview window. Typically, a group is an OpenVMS Cluster. Groups are displayed in alphabetical order. Nodes within a group are also displayed in alphabetical order.
You can also expand and collapse specific group displays by clicking
MB3 while the cursor is on the selected group and choosing either the
Hide Nodes or Show Nodes menu item.
2.2.2 Displaying Additional Data
By default, the Data Analyzer collects, analyzes, and displays four categories of data from Data Provider nodes:
In addition to the default data, you can choose any of these categories of additional data to be collected, analyzed, and displayed:
You can change the default data windows that are displayed with the DECamds Application Customizations dialog box. For more information about customizing DECamds, see Chapter 5.
Data gathering and display consume CPU time and network bandwidth. Request only the data you need to conclude an investigation, and then stop collecting the data (see Section 2.2.3). Whenever possible, collect data for just one node, not the entire group. |
To request a specific data category, do one of the following:
To stop collecting data, do one of the following:
Choosing Close Display from the File menu of any data window closes the window but continues data collection as a background task. |
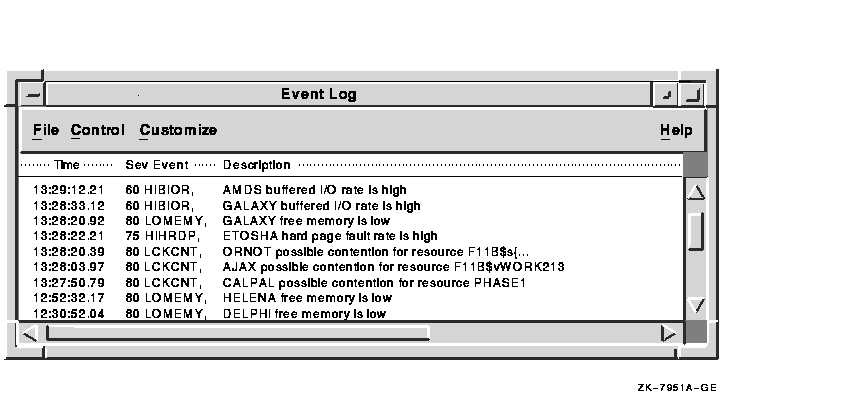
The Event Log window allows you to identify and correct a system problem. The Event Log window displays a warning message whenever DECamds detects a resource availability problem. Figure 2-3 shows an Event Log window.
Figure 2-3 Event Log Window

DECamds writes all events to a log file (AMDS$LOG:AMDS$EVENT_LOG.LOG). You can read this file in the Event Log window while the application is running.
Ignore event messages that report the system process "SWAPPER" as having used all its quotas. The SWAPPER process is the OpenVMS memory management process; it does not have its quotas defined in the same way other system and user processes do. |
Table 2-2 explains the fields displayed in the Event Log window.
| Field | Description |
|---|---|
| Time | Displays, in real time, the time that an event is detected. |
| Sev (Severity) | Displays a value from 0 to 100. By default, events are listed in the Event Log window in order of decreasing severity. 0 is an informational message; 100 is a severe event. An event severity of 80 is high and indicates a potentially serious problem. Events with a severity of less than 50 appear dimmed, to indicate that they are less important. See Chapter 5 for information about how to change the display of severe events. Events that are critical are also sent to the OpenVMS operator communication manager (OPCOM). |
| Event | Displays an alphanumeric identifier of the type of event. |
| Description | Displays the node or group name and a short description of the resource availability problem. |
When an event "times out" by an improvement in availability, it is removed from the display. Events that are not triggered by a condition are timed out after 30 seconds (for example, the "CFGDON, node configuration done" event). When you select an event, the event remains displayed for 15 seconds (or until you initiate another task in the window), even if the event times out.
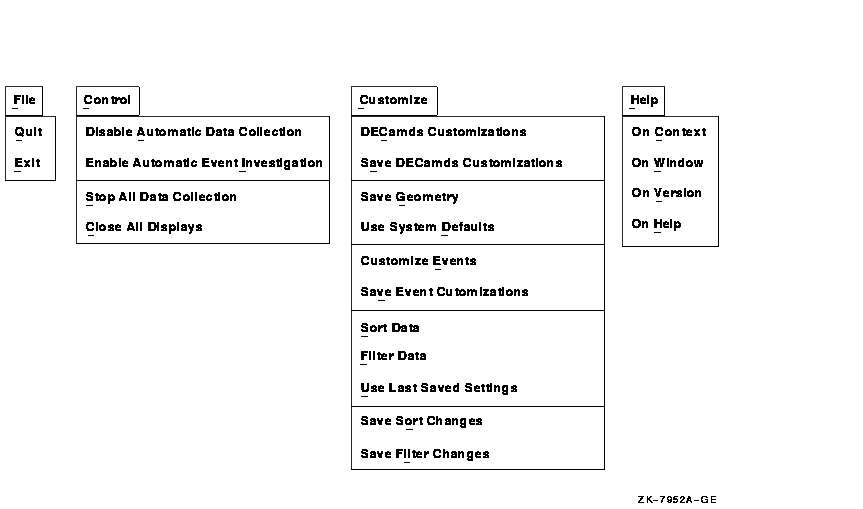
Figure 2-4 shows the Event Log window options.
Figure 2-4 Event Log Window Menus

For information about customizing event log information, see Section 5.2.1.
| Previous | Next | Contents | Index |