 |
DECamds User's Guide
DECamds displays them in the Event Log window. Node is
replaced by the name of the node to which the event is related.
Process is replaced by the name of the process to which the
event is related.
LOASTQ, node process has used most of its ASTLM process quota
LOBIOQ, node process has used most of its BIOLM process
quota
LOBYTQ, node process has used most of its BYTLM job quota
LODIOQ, node process has used most of its DIOLM process
quota
LOENQU, node process has used most of its ENQLM job quota
LOFILQ, node process has used most of its FILLM job quota
LOPGFQ, node process has used most of its PGFLQUOTA job
quota
LOPRCQ, node process has used most of its PRCLM process
quota
LOTQEQ, node process has used most of its TQELM job quota
LOWEXT, node process working set extent is too small
LOWSQU, node process working set quota is too small
PRBIOR, node process buffered I/O rate is high
PRBIOW, node process waiting for buffered I/O
PRCCOM, node process waiting in COM or COMO
PRCCUR, node process has high CPU rate
PRCMUT, node process waiting for a mutex
PRCPUL, node process has used most of its CPUTIME process
quota
PRCPWT, node process waiting in COLPG, PFW, or FPG
PRCQUO, node process waiting for a quota
PRCRWA, node process waiting in RWAST
PRCRWC, node process waiting in RWCAP
PRCRWM, node process waiting in RWMBX
PRCRWP, node process waiting in RWPAG, PWNPG, RWMPE, or
RWMPB
PRCRWS, node process waiting in RWSCS, RWCLU, or RWCSV
PRCUNK, node process waiting for a system resource
PRDIOR, node process direct I/O rate is high
PRDIOW, node process waiting for direct I/O
PRLCKW, node process waiting for a lock
PRPGFL, node process high page fault rate
PRPIOR, node process paging I/O rate is high
3.11 Lock Contention Summary Window
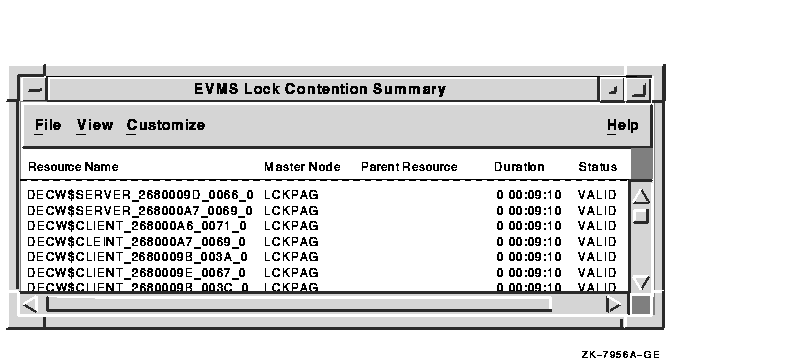
The Lock Contention Summary window shown in Figure 3-12 determines
which resources are under contention. It displays all the OpenVMS Lock
Manager resources that have potential lock contention situations. The
Lock Contention Summary window is available only for groups; attempting
to open a Lock Contention Summary for a node opens the node's group
window.
Figure 3-12 Lock Contention Summary Window

Locks are written to AMDS$LOCK_LOG.LOG; see Section B.3 for more
information. To interpret the information displayed in the Lock
Contention Summary window, you should have an understanding of OpenVMS
lock management services. For more information, see the OpenVMS System Services Reference Manual.
Note
Lock contention data is accurate only if every node in an OpenVMS
Cluster environment is in the same group. Multiple clusters can share a
group, but clusters cannot be divided into different groups without
losing accuracy.
|
You can open a Lock Contention Summary window from the Event Log or
System Overview windows, as follows:
- In the Event Log window, click MB3 on any lock contention-related
event and choose Display from the menu.
- In the System Overview window:
- Click MB3 on any node or group line, and choose Display from the
menu.
- Choose Lock Contention Summary from the submenu.
Table 3-12 describes the Lock Contention Summary window data fields.
Table 3-12 Lock Contention Summary Window Data Fields
| Field |
Displays |
|
Resource Name
|
The resource name associated with the $ENQ system service call.
|
|
Master Node
|
The node on which the resource is mastered.
|
|
Parent Resource
|
The name of the parent resource. If no name is displayed, the resource
listed is the parent resource.
|
|
Duration
|
The amount of time elapsed since DECamds first detected the contention
situation.
|
|
Status
|
The status of the lock. See the $ENQ(W) description in the OpenVMS System Services Reference Manual.
|
You can open a Single Lock Summary window from the Lock Contention
Summary window. See Section 3.12 for more information.
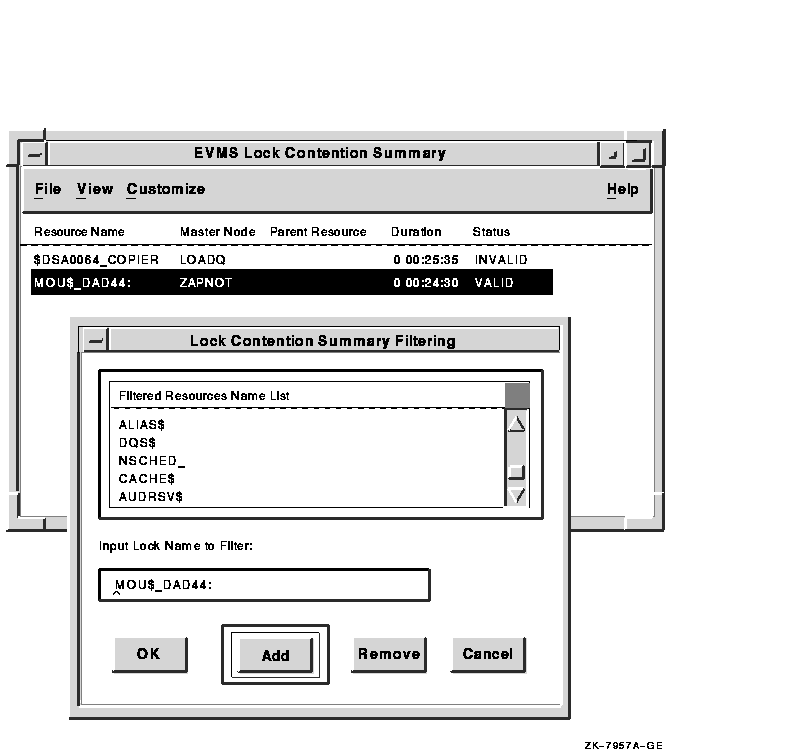
Figure 3-13 shows how to determine which filters can or cannot be
displayed. To filter specific locks from the display, choose Filter
Data... from the Customize menu on the Lock Contention Summary window.
A filter dialog box appears with a list of locks currently being
filtered from the display.
To add a filter, use either of the following methods:
- Type the name of a filter in the Input Lock Name to Filter field
and click on the Add button. You can use the asterisk (*) wildcard
character to specify a range of filters. For example, $DSA*$WAITER will
filter all locks beginning with $DSA and ending with $WAITER and
anything in between.
- Click on a lock in the Lock Contention Summary window. The name of
the lock will appear in the Input Lock Name to Filter field (as shown
in Figure 3-13). You must click on the Add button to add the filter.
Figure 3-13 Filtering Lock Events

You can remove a lock from the filter list by selecting a lock and
clicking on the Remove button. Any lock contentions affected by the
removed filter will be displayed.
DECamds detects the following lock contention-related events and
displays them in the Event Log window. Italicized words are replaced
with actual values.
LCKCNT, node possible contention for resource resource
LRGHSH, node lock hash table too large n entries
RESDNS, node resource hash table dense percentage
full n resources, hash table size n
RESPRS, node resource hash table sparse, only
percentage full n resources, table size n
3.12 Single Lock Summary Window
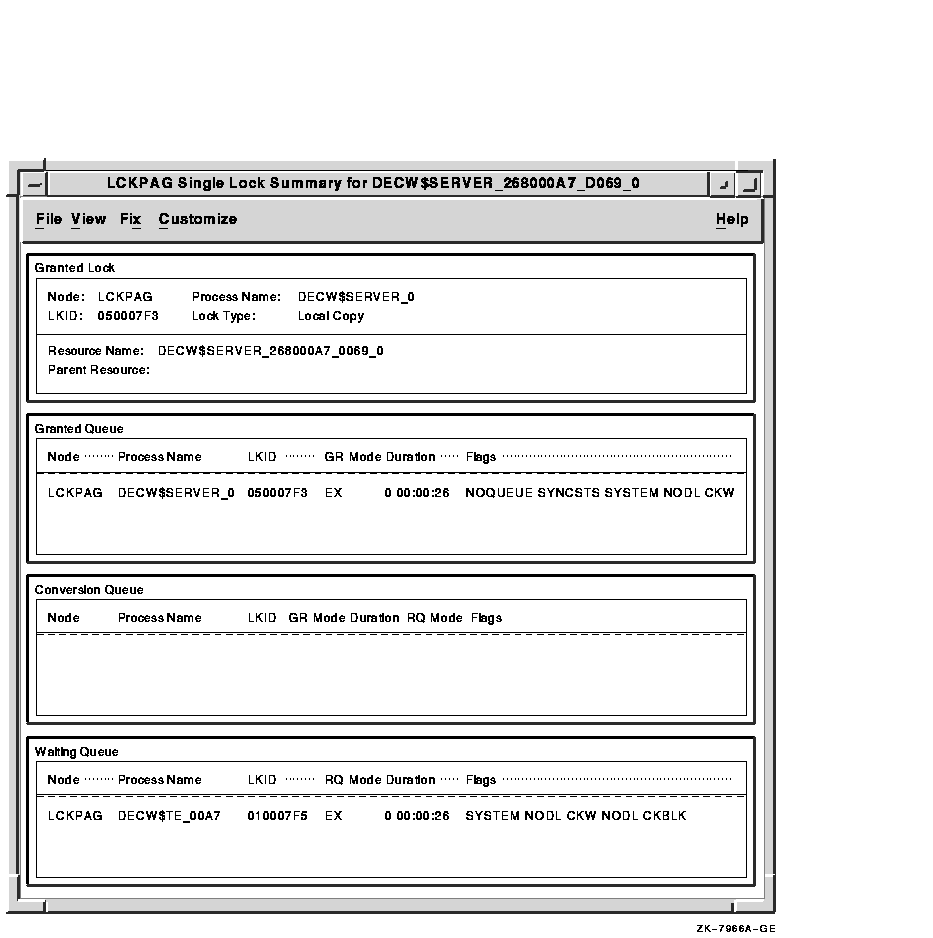
The Single Lock Summary window shown in Figure 3-14 displays data
about a blocking lock and all locks in the granted, conversion, and
waiting queues. You can use it to display detailed information about a
lock contention situation. The lock name is specified in the title bar.
All locks are written to AMDS$LOCK_LOG.LOG; see Section B.3 for more
information.
Figure 3-14 Single Lock Summary Window

In a Single Lock Summary window, if DECamds cannot determine the node
name for the group, it uses the cluster system ID (CSID) value, which
the OpenVMS Cluster software uses to uniquely identify cluster members.
To open a Single Lock Summary window, do one of the following:
- In the Lock Contention Summary window, double-click on any field.
You can also click MB3 on any field, and choose Display Lock from the
menu.
- In the View menu of the Lock Contention Summary window, choose
Display Lock.
- In the Event Log window, click MB3 on any lock blocking-related or
lock waiting-related event, and choose Display from the menu.
Table 3-13 describes the Single Lock Summary window data fields.
Table 3-13 Single Lock Summary Window Data Fields
| Field |
Displays |
| Granted Lock |
|
Node
|
The node name on which the lock is granted.
|
|
LKID
|
The lock ID value (which is useful with SDA).
|
|
Process Name
|
The name of the process owning the blocking lock.
|
|
Lock Type
|
One of the following: Local Copy, Process Copy, or Master Copy.
|
|
Resource Name
|
The name of the resource.
|
|
Parent Resource
|
The name of the parent resource (if any).
|
| Granted, Conversion, and Waiting Queue |
|
Node
|
The node on which the lock block resides.
|
|
Process Name
|
The process name of the process owning the lock.
|
|
LKID
|
The lock ID value (which is useful with SDA).
|
|
GR Mode
|
One of the following modes at which the lock is granted: EX, CW, CR,
PW, PR, NL.
|
|
RQ Mode
|
One of the following modes at which the lock is requested: EX, CW, CR,
PW, PR, NL.
|
|
Duration
|
The length of time the lock has been in the current queue (since the
console application found the lock).
|
|
Flags
|
The flags specified with the $ENQ(W) request.
|
You can open a window about a specific process in the Single Lock
Summary window by double-clicking on the process name.
Note
Processes that are labeled unknown are associated with system
locks. They cannot be opened.
|
DECamds detects the following single lock-related events and displays
them in the Event Log window. Node is replaced by the name of
the node to which the event is related. Process is replaced by
the name of the process to which the event is related.
LCKBLK, node process blocking resource resource
LCKWAT, node process waiting for resource
resource granted to process on node node
3.13 Cluster Transition/Overview Summary Window
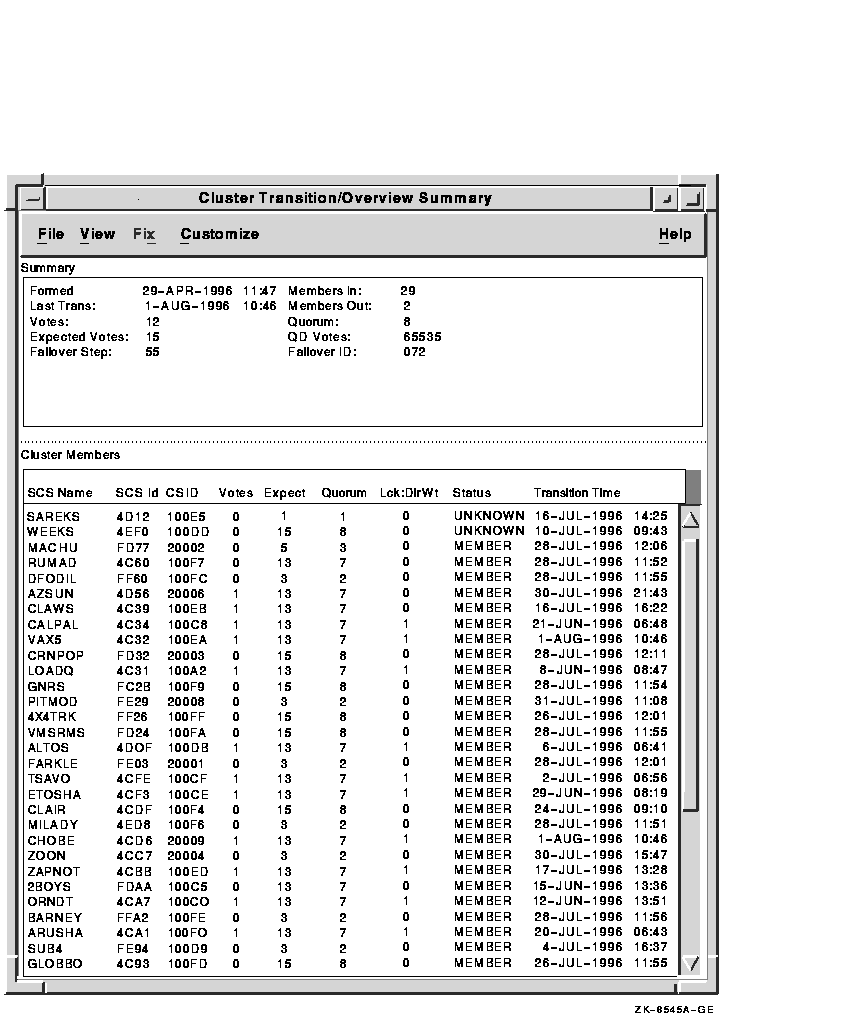
The Cluster Transition/Overview Summary window shown in Figure 3-15
displays information about each node in an OpenVMS Cluster. This window
is very similar to the System Overview window; however, the Cluster
Transition window lists only one cluster for each set of nodes in a
cluster, while the System Overview window lists all the nodes and the
user-defined groups the nodes are in.
The window displays summary information as well as information about
individual nodes: System Communication Services (SCS) name, SCS ID,
Cluster System ID, Votes, Lock Directory Weight value, cluster status,
and last transition time.
The data items shown in the window correspond to data that the Show
Cluster utility displays for the SYSTEM and MEMBERS classes. A status
field display of "unknown" usually indicates that DECamds is not
communicating with the node.
Figure 3-15 Cluster Transition/Overview Summary Window

To open the Cluster Transition/Overview Summary window, do either of
the following:
- In the System Overview window, click MB3 on a node line. Choose
Display from the menu displayed and Cluster Transition Summary from the
submenu. The system displays the Cluster Transition/Overview Summary
window.
- In the Event Log window, Click MB3 on a cluster-related event.
Choose Display from the menu displayed and Cluster Transition Summary
from the list displayed.
Note: The Cluster Transition Summary menu option is
not available for nodes that are not in the cluster; it is not
available from lines that display groups.
3.13.1 Data Displayed
The Cluster Transition/Overview window has two panel displays:
- The Summary (top) panel displays cluster summary information.
- The Cluster Members (bottom) panel lists each node in the cluster.
Table 3-14 describes the Summary panel data fields.
Table 3-14 Data Items in the Summary Panel of the Cluster Transition/Overview Summary Window
| Data Item |
Description |
|
Formed
|
Date and time the cluster was formed.
|
|
Last Trans
|
Date and time of the most recent cluster state transition.
|
|
Votes
|
Total number of quorum votes being contributed by all cluster members
and quorum disk.
|
|
Expected Votes
|
Number of votes expected to be contributed by all members of the
cluster as determined by the connection manager. This value is based on
the maximum of the EXPECTED_VOTES system parameter and the maximized
value of the VOTES system parameter.
|
|
Failover Step
|
Current failover step index; shows which step in the sequence of
failover steps the failover is currently executing.
|
|
Members In
|
Number of members of the cluster DECamds has a connection to.
|
|
Members Out
|
Number of members of the cluster DECamds either has no connection to or
has lost connection to.
|
|
Quorum
|
Number of votes required to keep cluster above quorum.
|
|
QD Votes
|
Number of votes given to Quorum Disk. A value of 65535 means there is
no Quorum Disk.
|
|
Failover ID
|
Failover Instance Identification: unique ID of a failover sequence;
indicates to system managers whether a failover has occurred since the
last time they checked.
|
Table 3-15 describes the Cluster Members panel data fields.
Table 3-15 Data Items in the Cluster Members Panel of the Cluster Transition/Overview Summary Window
| Data Item |
Description |
|
SCS Name
|
System Communication Services name for the node (system parameter
SCSNODE)
|
|
SCS id
|
System Communication Services identification for the node (system
parameter SCSYSTEMID)
|
|
CSID
|
Cluster System Identification
|
|
Votes
|
Number of votes the member contributes
|
|
Expect
|
Expected votes to be contributed as set by the EXPECTED_VOTES system
parameter
|
|
Quorum
|
Recommended quorum value derived from the expected votes
|
|
Lck:DirWt
|
Lock Manager distributed directory weight as determined by the LCKDIRWT
system parameter
|
|
Status
|
Current cluster member status: MEMBER, UNKNOWN, or BRK_NON (break
nonmember)
|
|
Transition Time
|
Time cluster member had last transition
|
3.13.2 Notes About the Display
Following are notes about the display of data in the window:
- No highlighting conventions are used in the window; all data items
are displayed in normal mode.
- You cannot filter out any data.
- The data items in the window are sorted on an "as-found" basis. You
cannot change the sort criteria.
- When you click on an item, DECamds temporarily stops updating the
window for 15 seconds or until you choose an item from a menu.
- DECamds signals the LOVOTE event when the difference between the
cluster's quorum and votes values is less than the threshold
for the event:
LOVOTE, 'node' VOTES count is close to or below QUORUM
|
The default threshold for LOVOTE is 1.
- You can change collection intervals.
3.14 System Communications Architecture Summary Window
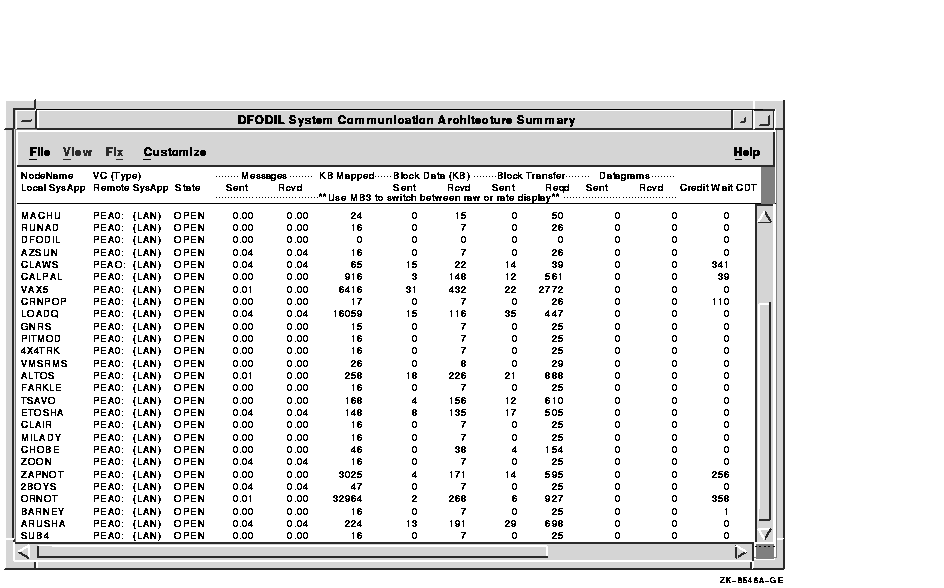
The System Communications Architecture Summary (SCA Summary) window
shown in Figure 3-16 displays information about a selected node's
virtual circuits and connections to other nodes in a cluster. (The
display represents the view one node has of other nodes in the
cluster.) More than one type of virtual circuit indicates that more
than one path to the remote node exists.
Figure 3-16 SCA Summary Window

Each line in the window shows either a summary of all system
applications (SysApps) using the virtual circuit communication or the
communication on the connection between a local and a remote SysApp.
The data displayed in the window is similar to the information that the
Show Cluster utility displays for the CIRCUITS, CONNECTIONS, and
COUNTERS classes. Unlike Show Cluster, however, this display shows only
SCA connections to other OpenVMS nodes; it does not show SCA
connections to the Disk Storage Architecture (DSA) or to devices such
as FDDI or DSSI disk controllers.
By clicking MB3 on a node name and choosing View SysApps from the
pop-up menu, you can display the system applications that are using
virtual circuits. This option expands the list below a virtual circuit
to show all the system applications that contribute to that virtual
circuit. (The SysApp lines are dimmed and right-justified.)
To hide the display of system applications, click MB3 and choose Hide
SysApps from the pop-up menu.
To display a menu that allows you to toggle between Raw and Rate data,
click MB3 on the data to the right of the State field. (For messages,
the default is the display of rate data; raw data is the default for
all other types of data.)
To open an SCA Summary window, follow these steps:
- In the Cluster Transition/Overview Summary window, click MB3 on an
SCS name.
The system displays a pop-up menu.
- Choose Display SCA Summary.
The system displays the System
Communication Architecture (SCA) Summary window.
Table 3-16 describes the SCA Summary window data fields.
Table 3-16 Data Items in the SCA Summary Window
| Data Item |
Description |
|
NodeName
|
SCS name of the remotely connected node.
|
|
VC(Type)
|
The virtual circuit being used and its type.
|
|
State
|
The state of the virtual circuit connection.
|
|
Messages
|
Relatively small data packets sent and received between nodes for
control information.
|
|
Block Transfer
|
Fields listing the count of the number of block data transfers and
requests initiated.
|
|
KB Mapped
|
Field listing the number of kilobytes mapped for block data transfer.
Note: This field is available in Raw data format only.
|
|
Block Data (KB)
|
Fields listing in kilobytes the data transferred via block data
transfer.
|
|
Datagrams
|
Number of unacknowledged messages sent between virtual circuits.
|
|
Credit Wait
|
Number of times the connection had to wait for a send credit.
|
|
CDT Wait
|
Number of times the connection had to wait for a buffer descriptor.
|
|
Local SysApp
|
Name of the local system application using the virtual circuit.
|
|
Remote SysApp
|
Name of the remote system application being communicated to.
|
|
