 |
OpenVMS Alpha System Analysis Tools Manual
If the virtual page has been mapped to a physical page, the last six
columns of the listing include information from the page frame number
(PFN) database; otherwise, the section is left blank. Table 4-8
describes the physical page information displayed by the SHOW
PAGE_TABLE command.
Table 4-8 Physical Page Information in the SHOW PAGE_TABLE Display
| Category |
Meaning |
|
PGTYP
|
Type of physical page. Table 4-9 shows the types of physical pages.
|
|
LOC
|
Location of the page within the system. Table 4-10 shows the
possible locations with their meaning.
|
|
BAK
|
Place to find information on this page when all links to this PTE are
broken: either an index into a process section table or the number of a
virtual block in the paging file.
|
|
REFCNT
|
Number of references being made to this page.
|
|
FLINK
|
Forward link within PFN database that points to the next physical page
(if the page is on one of the lists: FREE, MODIFIED, BAD, or ZEROED);
this longword also acts as the count of the number of processes that
are sharing this global section.
|
|
BLINK
|
Backward link within PFN database (if the page is on one of the lists:
FREE, MODIFIED, BAD, or ZEROED); also acts as an index into the working
set list.
|
Table 4-9 Types of Physical Pages
| Page Type |
Meaning |
|
PROCESS
|
Page is part of process space.
|
|
SYSTEM
|
Page is part of system space.
|
|
GLOBAL
|
Page is part of a global section.
|
|
PPGTBL
|
Page is part of a process page table.
|
|
PHD
1
|
Page is part of a process PHD.
|
|
PPT(Ln)
1
|
Page is a process page table page at level
n.
|
|
SPT(Ln)
1
|
Page is a system page table page at level
n.
|
|
GPGTBL
|
Page is part of a global page table.
|
|
GBLWRT
|
Page is part of a global, writable section.
|
|
SHPT
2
|
Page is part of a shared page table.
|
|
UNKNOWN
|
Unknown.
|
1These page types are variants of the PPGTBL page type.
2The SHPT page type is a variant of the GBLWRT page type.
Table 4-10 Location of the Page
| Location |
Meaning |
|
ACTIVE
|
Page is in a working set.
|
|
MFYLST
|
Page is in the modified page list.
|
|
FRELST
|
Page is in the free page list.
|
|
BADLST
|
Page is in the bad page list.
|
|
RELPND
|
Release of the page is pending.
|
|
RDERR
|
Page has had an error during an attempted read operation.
|
|
PAGOUT
|
Page is being written into a paging file.
|
|
PAGIN
|
Page is being brought into memory from a paging file.
|
|
ZROLST
|
Page is in the zeroed-page list.
|
|
UNKNWN
|
Location of page is unknown.
|
SDA indicates pages are inaccessible by displaying one of the following
messages:
-------   1 null page:       VA   FFFFFFFE.00064000     PTE   FFFFFFFD.FF800190

------- 974 null pages:      VA   FFFFFFFE.00064000     PTE   FFFFFFFD.FF800190
                             -to- FFFFFFFE.007FDFFF     -to-  FFFFFFFD.FF801FF8
|
In this case, the page table entries are not in use (page referenced is
inaccessible).
-------      1 entry not in memory:    VA   FFFFFFFE.00800000   PTE   FFFFFFFD.FF802000

------- 784384 entries not in memory:  VA   FFFFFFFE.00800000   PTE   FFFFFFFD.FF802000
                                       -to- FFFFFFFF.7F7FDFFF   -to-  FFFFFFFD.FFDFDFF8
|
In this case, the page table entries do not exist (PTE itself is
inaccessible).
-------    1 free PTE:    VA   FFFFFFFF.7F800000   PTE   FFFFFFFD.FFDFEOOO

------- 1000 free PTEs:   VA   FFFFFFFF.7F800000   PTE   FFFFFFFD.FFDFE000
                          -to- FFFFFFFF.7FFCDFFF   -to-  FFFFFFFD.FFDFFF38
|
In this case, the page table entries are in the list of free system
pages.
In each case, "VA" is the MAPPED ADDRESS of the skipped entry, and
"PTE" is the PTE ADDRESS of the skipped entry.
Examples
For an example of SHOW PAGE_TABLE output when the qualifier /FREE has
not been given, see the SHOW PROCESS/PAGE_TABLES command.
| #2 |
SDA> SHOW PAGE_TABLE/FREE
S0/S1 Space Free PTEs
---------------------
 MAPPED ADDRESS        PTE ADDRESS             PTE           COUNT

FFFFFFFF.82A08000   FFFFFFFD.FFE0A820   0001FFE0.A8580000   00000003
FFFFFFFF.82A16000   FFFFFFFD.FFE0A858   0001FFE0.A8900000   00000003
FFFFFFFF.82A24000   FFFFFFFD.FFE0A890   0001FFE0.B3C00000   00000003
FFFFFFFF.82CF0000   FFFFFFFD.FFE0B3C0   0001FFE0.B4010000   00000001
FFFFFFFF.82D00000   FFFFFFFD.FFE0B400   0001FFE0.B4680000   00000002

   .
   .
   .
FFFFFFFF.82E48000   FFFFFFFD.FFE0B920   0001FFE0.B9390000   00000001
FFFFFFFF.82E4E000   FFFFFFFD.FFE0B938   0001FFE0.BA200000   00000002
FFFFFFFF.82E88000   FFFFFFFD.FFE0BA20   0001FFE0.C9780000   00000003
FFFFFFFF.8325E000   FFFFFFFD.FFE0C978   0001FFE0.CC980000   00000003
FFFFFFFF.83326000   FFFFFFFD.FFE0CC98   00000000.00000000   0000066D
|
This example shows the output when you invoke the SHOW PAGE_TABLE/FREE
command.
SHOW PARAMETER
Displays the name, location, and value of one or more SYSGEN parameters
at the time that the system dump is taken.
Format
SHOW PARAMETER [SYSGEN_parameter]
[/ACP][/ALL][/CLUSTER][/DYNAMIC][/GALAXY]
[/GEN][/JOB][/LGI][/MAJOR][/MULTIPROCESSING]
[/PQL][/RMS][/SCS][/SPECIAL][/SYS][/STARTUP]
[/TTY]
Parameter
SYSGEN_parameter
The name of a parameter to be displayed. The name given may include
wildcards. However, a truncated name is not recognized, unlike the
equivalent SYSGEN and SYSMAN commands.
Qualifiers
/ACP
Displays all Files-11 ACP parameters.
/ALL
Displays the values of all parameters except the special control
parameters.
/CLUSTER
Displays all parameters specific to clusters.
/DYNAMIC
Displays all parameters that can be changed on a running system.
/GALAXY
Displays all parameters specific to Galaxy systems.
/GEN
Displays all general parameters.
/JOB
Displays all Job Controller parameters.
/LGI
Displays all LOGIN security control parameters.
/MAJOR
Displays the most important parameters.
/MULTIPROCESSING
Displays parameters specific to multiprocessing.
/PQL
Displays the parameters for all default and minimum process quotas.
/RMS
Displays all parameters specific to OpenVMS Record Management Services
(RMS).
/SCS
Displays all parameters specific to OpenVMS Cluster System
Communications Services.
/SPECIAL
Displays all special control parameters.
/STARTUP
Displays the name of the site-independent startup procedure.
/SYS
Displays all active system parameters.
/TTY
Displays all parameters for terminal drivers.
Description
The SHOW PARAMETER command displays the name, location and value of one
or more SYSGEN parameters at the time that the system dump is taken.
You can specify either a parameter name, or one or more qualifiers, but
not both a parameter and qualifiers. If you do not specify a parameter
nor qualifiers, then the last parameter displayed is displayed again.
The qualifiers are the equivalent to those available for the SHOW
[parameter] command in the SYSGEN utility and the PARAMETERS SHOW
command in the SYSMAN utility. See the OpenVMS System Management Utilities Reference Manual: M--Z for more
informaton about these two commands. You can combine qualifiers, and
all appropriate SYSGEN parameters are displayed.
Note
To see the entire set of parameters, use the SDA command
SHOW PARAMETER /ALL /SPECIAL /STARTUP.
|
Examples

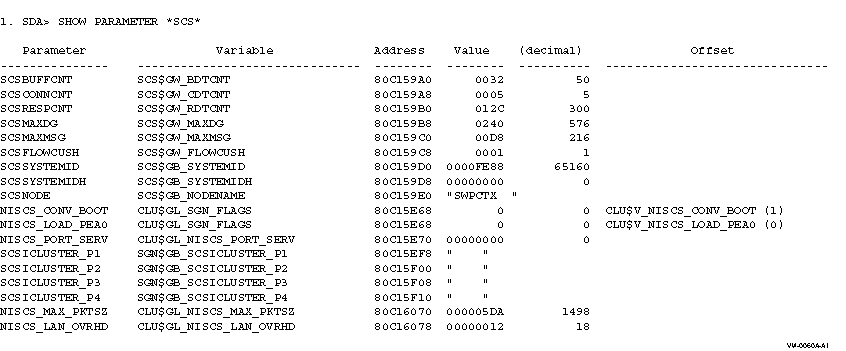
This example shows all parameters that have the string "SCS" in their
name. Note that for parameters defined as a single bit, the name and
value of the bit offset within the location used for the parameter are
also given.

This example shows all parameters whose names begin with the string
"WS". Note that for parameters that have both an external value
(pagelets) and an internal value (pages), both are displayed.

This example shows all the parameters specific to multiprocessing, plus
the name of the site-independent startup command procedure.
SHOW PFN_DATA
Displays information that is contained in the page lists and PFN
database.
Format
SHOW PFN_DATA {[/qualifier]|pfn [{:end-pfn|;length}]}
or
SHOW PFN_DATA/MAP
Parameters
pfn
Specifies the page frame number (PFN) of the physical page for which
information is to be displayed.
length
Specifies the length of the PFN list to be displayed. When you specify
the length parameter, a range of PFNs is displayed.
This range starts at the PFN specified by the pfn
parameter and contains the number of entries specified by the
length parameter.
end-pfn
Specifies the last PFN to be displayed. When you specify the
end-pfn parameter, a range of PFNs is displayed. This
range starts at the PFN specified by the pfn parameter
and ends with the PFN specified by the end-pfn
parameter.
Qualifiers
/ADDRESS=<PFN-entry-address>
Displays the PFN database entry at the address specified. The address
specified is rounded to the nearest entry address so if you have an
address that points to one of the fields of the entry, the correct
database entry will still be found.
/ALL
Displays the following lists:
free page list
zeroed free page list
modified page list
bad page list
untested page list
private page lists, if any
per-color free and zeroed free page lists
entire database in order by page frame number
This is the default behavior of the SHOW PFN_DATA command. SDA precedes
each list with a count of the pages it contains and its low and high
limits.
/BAD
Displays the bad page list. SDA precedes the list with a count of the
pages it contains, its low limit, and its high limit.
/COLOR [={n|ALL}]
Displays data on page coloring. Table 4-11 shows the command options
available with this qualifier.
Table 4-11 Command Options with the /COLOR and /RAD Qualifiers
| Options |
Meaning |
|
/COLOR
1 with no value
|
Displays a summary of the lengths of the color
1 page lists for both free pages and zeroed pages.
|
|
/COLOR=
n where
n is a color number
|
Displays the data in the PFN lists (for the specified color) for both
free and zeroed pages.
|
|
/COLOR=ALL
|
Displays the data in the PFN lists (for all colors), for both free and
zeroed free pages.
|
|
/COLOR=
n or /COLOR=ALL with /FREE or /ZERO
|
Displays only the data in the PFN list (for the specified color or all
colors), for either free or zeroed free pages as appropriate. The
qualifiers /BAD and /MODIFIED are ignored with /COLOR=
n and /COLOR=ALL.
|
|
/COLOR without an option specified together with one or more of /FREE,
/ZERO, /BAD, or /MODIFIED
|
Displays the color summary in addition to the display of the requested
list(s).
|
1Wherever COLOR is used in this table, RAD is equally
applicable, both in the qualifier name and the meaning.
For more information on page coloring, see OpenVMS System Management Utilities Reference Manual: M--Z.
/FREE
Displays the free page list. SDA precedes the list with a count of the
pages it contains, its low limit, and its high limit.
/MAP
Displays the contents of the PFN memory map. On platforms that support
it, the I/O space map is also displayed. The /MAP qualifier cannot be
combined with any parameters or other qualifiers.
/MODIFIED
Displays the modified page list. SDA precedes the list with a count of
the pages it contains, its low limit, and its high limit.
/PRIVATE [=address]
Displays private PFN lists. If no address is given, all private PFN
lists are displayed; if an address is given, only the PFN list whose
head is at the given address is displayed.
/RAD [={n|ALL}]
Displays data on the disposition of pages among the Resource Affinity
Domains on applicable systems. See Table 4-11 for the command
options available with this qualifier.
/SYSTEM
Displays the entire PFN database in order by page frame number,
starting at PFN 0000.
/UNTESTED
Displays the state of the untested PFN list that was set up for
deferred memory testing.
/ZERO
Displays the contents of the zeroed free page list.
Description
For each page frame number it displays, the SHOW PFN_DATA command lists
information used in translating physical page addresses to virtual page
addresses. The display has two lines of information. Table 4-12
shows the first line's fields; Table 4-13 shows the second line's
fields.
Table 4-12 Page Frame Number Information---Line One Fields
| Item |
Contents |
|
PFN
|
Page frame number.
|
|
DB ADDRESS
|
Address of PFN structure for this page.
|
|
PT PFN
|
PFN of the page page table page that maps this page.
|
|
BAK
|
Place to find information on this page when all links to this PTE are
broken: either an index into a process section table or the number of a
virtual block in the paging file.
|
|
FLINK
|
Forward link within PFN database that points to the next physical page
(if the page is on one of the lists: FREE, MODIFIED, BAD, or ZEROED);
this longword also acts as the count of the number of processes that
are sharing this global section.
|
|
BLINK
|
Backward link within PFN database (if the page is on one of the lists:
FREE, MODIFIED, BAD, or ZEROED); also acts as an index into the working
set list.
|
|
SWP/BO
|
Either a swap file page number or a buffer object reference count,
depending on a flag set in the page state field.
|
|
LOC
|
Location of the page within the system. Table 4-10 shows the
possible locations with their meaning.
|
|
FLAGS
|
The flags in text form that are set in page state. Table 4-14 shows
the possible flags and their meaning.
|
Table 4-13 Page Frame Number Information---Line Two Fields
| Item |
Contents |
|
Blank
|
|
|
PTE ADDRESS
|
Virtual address of the page table entry that describes the virtual page
mapped into this physical page. If no virtual page is mapped into this
physical page then "<no backpointer>" is displayed.
|
|
PTE Type
|
If a virtual page is mapped into this physical page, a description of
the type of PTE is provided in the next two or three columns: one of
"System-space PTE", "Global PTE", "Process PTE (process index
nnnn"). If no virtual page is mapped into this physical page,
these columns are left blank.
|
|
REFCNT
|
Number of references being made to this page.
|
|
PAGETYP
|
Type of physical page. See Table 4-9 for the types of physical
pages and their meanings.
|
|
FLAGS
|
If the page is a page table page, then the contents of the
PRN$W_PT_VAL_CNT, PFN$W_PT_LCK_CNT, and PFN$W_PT_WIN_CNT fields are
displayed. The format is as follows:
 VALCNT =
nnnn LCKCNT =
nnnn WINCNT =
nnnn
|
Table 4-14 Flags Set in Page State
| Flag |
Meaning |
|
BUFOBJ
|
Set if any buffer objects reference this page
|
|
COLLISION
|
Indicates an empty collision queue when page read is complete
|
|
BADPAG
|
Indicates a bad page
|
|
RPTEVT
|
Indicates a report event on I/O completion
|
|
DELCON
|
Indicates a delete PFN when REFCNT=
0
|
|
MODIFY
|
Indicates a dirty page (modified)
|
|
UNAVAILABLE
|
Indicates PFN is unavailable; most likely a console page
|
Examples
| #1 |
SDA> SHOW PFN_DATA/MAP
System Memory Map
-----------------

Start PFN   PFN count   Flags
---------   ---------   -----
00000000    000000FA    0009  Console Base
000000FA    00003306    000A  OpenVMS Base
00003C00    000003FF    000A  OpenVMS Base
00003FFF    00000001    0009  Console Base
00003400    00000800    0010  Galaxy_Shared
|
This example shows the output when you invoke the SHOW PFN/MAP command.

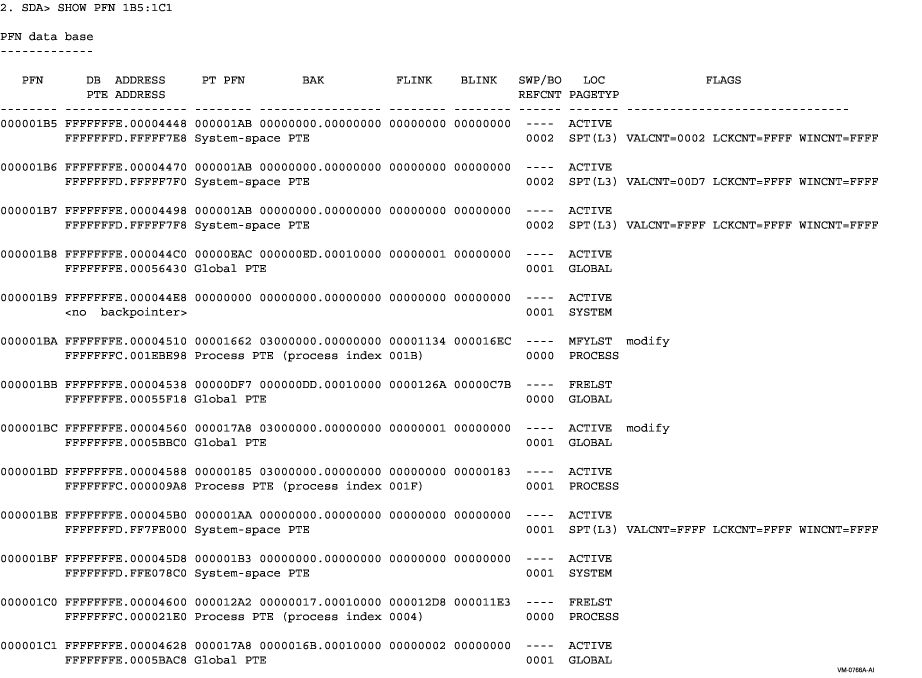
This example shows the output from SHOW PFN for a range of pages.
SHOW POOL
Displays the contents of the nonpaged dynamic storage pool, the
bus-addressable pool, and the paged dynamic storage pool. You can
display part or all of each pool. If you do not specify a range or
qualifiers, the default is SHOW POOL/ALL. Optionally, you can display
the pool history ring buffer and pool statistics.
Format
SHOW POOL {{range|/ALL (d)|/BAP |/NONPAGED|/PAGED}
[/BRIEF|/CHECK|/FREE|/HEADER
|/MAXIMUM_BYTES
[=n]|/SUMMARY |/TYPE=packet-type
|/SUBTYPE=packet-type|/UNUSED] |/RING_BUFFER
|/STATISTICS
[= ALL] [{/NONPAGED|/BAP|/PAGED}]}
Parameter
range
Range of virtual addresses in pool that SDA is to examine. You can
express a range using the following syntax:
|
m:n
|
Range of virtual addresses in pool from
m to
n
|
|
m;n
|
Range of virtual addresses in pool starting at
m and continuing for
n bytes
|
Qualifiers
/ALL
Displays the entire contents of dynamic storage pool, except for those
portions that are free (available). This is the default behavior of the
SHOW POOL command.
/BAP
Displays the contents of the bus-addressable dynamic storage pool
currently in use.
/BRIEF
Displays only general information about dynamic storage pool and its
addresses.
/CHECK
Checks all free packets for POOLCHECK-style corruption, in exactly the
same way that the system does when generating a POOLCHECK crashdump.
/FREE
Displays the entire contents, both allocated and free, of the specified
region or regions of pool. Use the /FREE qualifier with a
range to show all of the used and free pool in the
given range.
/HEADER
Displays only the first 16 longwords of each data packet found within
the specified region or regions of pool.
/MAXIMUM_BYTES [=n]
Displays only the first n bytes of a pool packet; default is
64 bytes.
/NONPAGED
Displays the contents of the
nonpaged dynamic storage pool currently in use.
/PAGED
Displays the contents of the paged dynamic storage pool currently in
use.
/RING_BUFFER
Displays the contents of the nonpaged pool history ring buffer if pool
checking has been enabled. Entries are displayed in reverse
chronological order, that is, most to least recent.
/STATISTICS [= ALL]
Displays usage statistics about each lookaside list and the variable
free list. For each lookaside list, its queue header address, packet
size, the number of packets, attempts, fails, and deallocations are
displayed. (If pool checking is disabled, the attempts, fails, and
deallocations are not displayed.) For the variable free list, its queue
header address, the number of packets and the size of the smallest and
largest packets are displayed. /STATISTICS can be further qualified by
using either /NONPAGED, /BAP, or /PAGED to display statistics for a
specified pool area. (Note that paged pool has no lookaside lists;
therefore, only variable free list statistics are displayed.)
If /STATISTICS is specified without the ALL keyword, only active
lookaside lists are displayed. Use /STATISTICS = ALL to display all
lookaside lists.
/SUBTYPE=packet-type
Displays the packets within the specified region or regions of pool
that are of the indicated packet-type. For information
on packet-type, see packet-type in the Description section.
/SUMMARY
Displays only an allocation summary for each specified region of pool.
/TYPE=packet-type
Displays the packets within the specified region or regions of pool
that are of the indicated packet-type. For information
on packet-type, see packet-type in the Description section.
/UNUSED
Displays only variable free packets and lookaside list packets, not
used packets.
Description
The SHOW POOL command displays information about the contents of any
specified region of dynamic storage pool. There are several distinct
display formats, as follows:
- Pool layout display. This display includes the addresses of the
pool structures and lookaside lists, and the ranges of memory used for
pool.
- Full pool packet display. This display has a section for each
packet, consisting of a summary line (the packet type, its start
address and size, and, on systems that have multiple Resource Affinity
Domains (RADs), the RAD number), followed by a dump of the contents of
the packet in hexadecimal and ASCII.
- Header pool packet display. This display has a single line for each
packet. This line contains the packet type, its start address and size,
and, on systems that have multiple RADs, the RAD number, followed by
the first sixteen bytes of the packet, in hexadecimal and ASCII.
- Pool summary display. This display consists of a single line for
each packet type, and includes the type, the number of occurrences and
the total size, and the percentage of used pool consumed by this packet
type.
- Pool statistics display. This display consists of statistics for
variable free pool and for each lookaside list. For variable free pool,
it includes the number of packets, the total bytes available, and the
sizes of the smallest and largest packets. In addition, if pool
checking is enabled, the total bytes allocated from the variable list
and the number of times pool has been expanded are also displayed.
For lookaside lists, the display includes the listhead address and
size, the number of packets (both the maintained count and the actual
count), the operation sequence number for the list, the allocation
attempts and failures, and the number of deallocations.
On systems
with multiple RADs, statistics for on-RAD deallocations are included in
the display for the first RAD.
- Ring buffer display. This display is only available when pool
checking is enabled. It consists of one line for each packet in the
ring buffer and includes the address and size of the pool packet being
allocated or deallocated, its type, the PC of the caller and the pool
routine called, the CPU and IPL of the call, and the system time.
|


