 |
OpenVMS Debugger Manual
10.4.5 Deactivating, Activating, and Canceling Breakpoints
After a breakpoint is set, you can deactivate, activate, or
delete it.
Deactivating a breakpoint causes the debugger to ignore the breakpoint
during program execution. However, the debugger keeps the breakpoint
listed in the breakpoint view so that you can activate it at a later
time, for example, when you rerun the program (see Section 9.3). Note
the following points:
- To deactivate a specific breakpoint, clear the button for that
breakpoint in the main window or in the breakpoint view.
In the
breakpoint view, you can also choose Toggle from the Break menu, if the
breakpoint is currently activated.
- To deactivate all breakpoints, choose Deactivate All from the
Break menu.
Activating a breakpoint causes it to take effect during program
execution:
- To activate a breakpoint, fill in the button for that breakpoint
in the main window or in the breakpoint view.
In the breakpoint
view, you can also choose Toggle from the Break menu, if the breakpoint
is currently deactivated.
- To activate all breakpoints, choose Activate All from the Break
menu.
When you cancel a breakpoint, it is no longer listed in the breakpoint
view so that later you cannot activate it from that list. You have to
reset the breakpoint as explained in Section 10.4.1 and Section 10.4.2.
Note the following points:
- To cancel a specific breakpoint, choose Cancel from the Break menu
on the optional views window.
- To cancel all breakpoints, choose Cancel All from the Break menu.
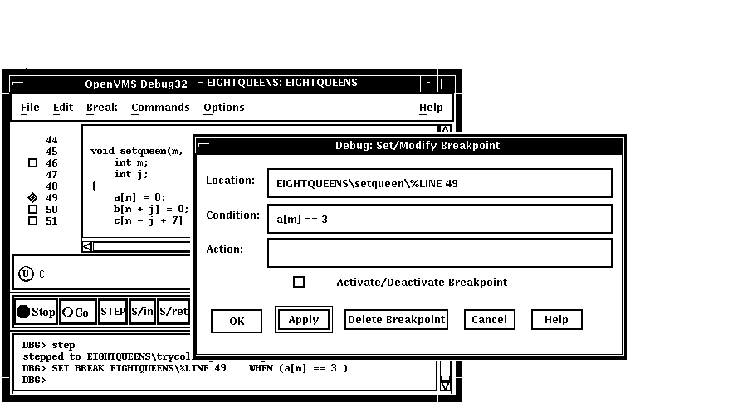
10.4.6 Setting a Conditional Breakpoint
The debugger suspends execution of the program at a conditional
breakpoint only when a specified expression is evaluated as true. The
debugger evaluates the conditional expression when program execution
reaches the breakpoint and ignores the breakpoint if the expression is
not true.
The following procedure sets a conditional breakpoint, whether or not a
breakpoint was previously set at that location:
- Display the source line on which you want to set the conditional
breakpoint (see Section 10.1).
- Do one of the following:
- Press Ctrl/MB1 on the button to the left of the source line. This
displays the Set/Modify Breakpoint dialog box, showing the source line
you selected in the Location: field (see Figure 10-6).
- Choose the Set or Set/Modify item from the Break menu. When the
Set/Modify Breakpoint dialog box displays, enter the source line in the
Location: field.
- Enter a relational expression in the Condition: field of the
dialog box. The expression must be valid in the source language. For
example, a[3] == 0 is a valid relational expression in the C
language.
- Click on OK. The conditional breakpoint is now set. The debugger
indicates that a breakpoint is conditional by changing the shape of the
breakpoint's button from a square to a diamond.
Figure 10-6 Setting a Conditional Breakpoint
The following procedure modifies a conditional breakpoint; that is, it
can be used either to change the location or condition associated with
an existing conditional breakpoint, or to change an unqualified
breakpoint into a conditional breakpoint:
- Choose Views... from the Options menu on the main window or
optional views window. When the Views dialog box appears, click on
Breakpoint View to display the breakpoint view.
- From the breakpoint view, do one of the following:
- Press Ctrl/MB1 on the button to the left of the listed breakpoint.
- Click on a breakpoint listed in the view, and choose the Set/Modify
item from the Break menu.
- Follow steps 3 and 4 of the previous procedure, as appropriate.
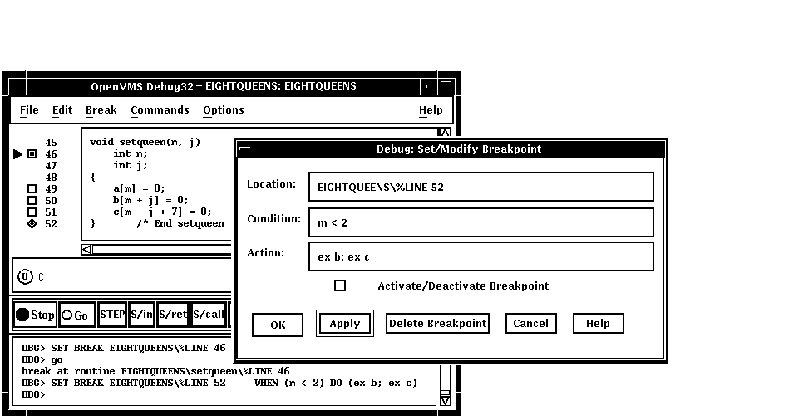
10.4.7 Setting an Action Breakpoint
When a program reaches an action breakpoint, the debugger suspends
execution of the program and executes a specified list of commands.
To set an action breakpoint, whether or not a breakpoint was previously
set at that location:
- Display the source line on which you want to set the action
breakpoint (see Section 10.1).
- Do one of the following:
- Press Ctrl/MB1 on the button to the left of the source line. This
displays the Set/Modify Breakpoint dialog box, showing the source line
you selected in the Location: field (see Figure 10-6).
- Choose the Set or Set/Modify item from the Break menu. When the
Set/Modify Breakpoint dialog box displays, enter the source line in the
Location: field.
- Enter one or more debugger commands in the Action: field of the
dialog box. For example:
DEPOSIT x[j] = 3; STEP; EXAMINE a
- Click on OK. The action breakpoint is now set (see Figure 10-7.)
Figure 10-7 Setting an Action Breakpoint
The following procedure modifies an action breakpoint; that is, it can
be used either to change the location or command associated with an
existing action breakpoint, or to change an unqualified breakpoint into
an action breakpoint:
- Choose Views... from the Options menu on the main window or
optional views window, then click on Breakpoint View when the Views
dialog box appears.
- From the breakpoint view, do one of the following:
- Press Ctrl/MB1 on the button to the left of the listed breakpoint.
- Click on a breakpoint listed in the view, and choose the Set/Modify
item in the Break menu.
- Follow steps 3 and 4 of the previous procedure, as appropriate.
10.5 Examining and Manipulating Variables
This section explains how to:
- Select variable names from windows
- Display the value of a variable
- Monitor a variable
- Watch a variable
- Change the value of a variable
See Section 10.6, which also applies to all operations on variables.
10.5.1 Selecting Variable Names from Windows
Use the following techniques to select variable names from windows for
the operations described in the sections that follow (see Section 10.5.2
for examples).
When selecting names, follow the syntax of the source programming
language:
- To specify a scalar (nonaggregate) variable, such as an integer,
real, Boolean, or enumeration type, select the variable's name.
- To specify an entire aggregate, such as an array or structure
(record), select the variable's name.
- To specify a single element of an aggregate variable, select the
entity using the language syntax. For example:
- The string
arr2[7]
specifies element 7 of array
arr2
in the C language.
- The string
employee.address
specifies component
address
of record (structure)
employee
in the Pascal language.
- To specify the object designated by a pointer variable, select the
entity following the language syntax. For example, in the C language,
the string
*int_point
specifies the object designated by pointer
int_point
.
Select character strings from windows as follows:
- In any window, to select a string delimited by blank spaces, use
the standard HP DECwindows Motif for OpenVMS word selection technique: position the
pointer on that string and then double click MB1.
- In any window, to select an arbitrary character string, use the
standard HP DECwindows Motif for OpenVMS text-selection technique: position the pointer
on the first character, press and hold MB1 while dragging the pointer
over the string and then release MB1.
- In the debugger source display, you also have the option of using
language-sensitive text selection. To select a string delimited by
language-dependent identifier boundaries, position the pointer on that
string and press
Ctrl/MB1.
For example, suppose the source display contains the
character string
arr2[m]
, then:
- To select
arr2
, position the pointer on
arr2
and press Ctrl/MB1.
- To select
m
, position the pointer on
m
and press Ctrl/MB1.
You can change the key sequence for language-sensitive text
selection as explained in Section 10.10.4.2.
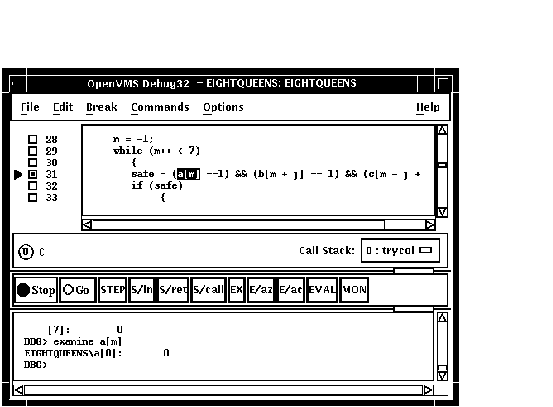
10.5.2 Displaying the Current Value of a Variable
To display the current value of a variable:
- Find and select the variable name in a window as explained in
Section 10.5.1.
- Click on the
EX button in the push button view. The debugger displays the variable
and its current value in the command view. The debugger displays the
value of a variable in the current scope, which might not be the same
as the source location you were intending.
Figure 10-8, Figure 10-9, and Figure 10-10 show how to display the
value of an integer variable, array aggregate, and array element,
respectively.
Figure 10-8 Displaying the Value of an Integer Variable
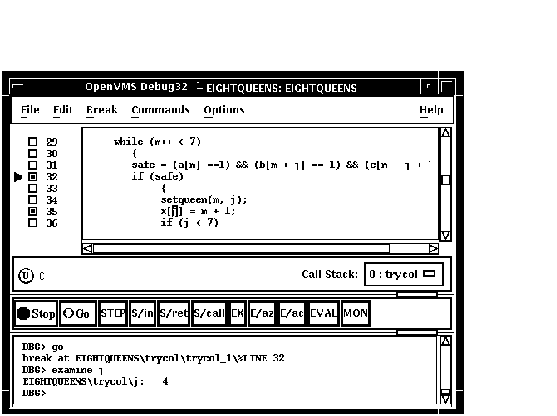
Figure 10-9 Displaying the Value of an Array Aggregate
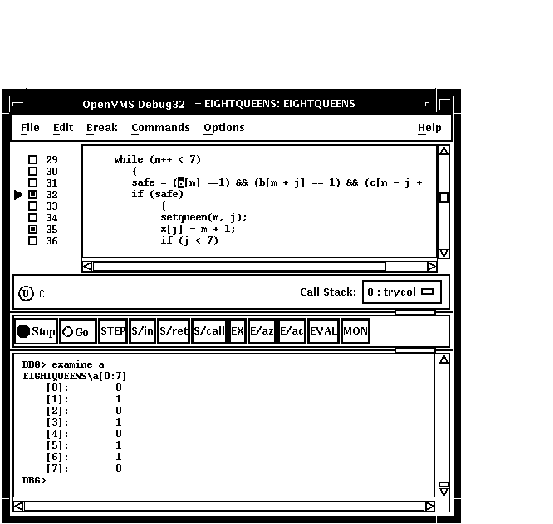
Figure 10-10 Displaying the Value of an Array Element
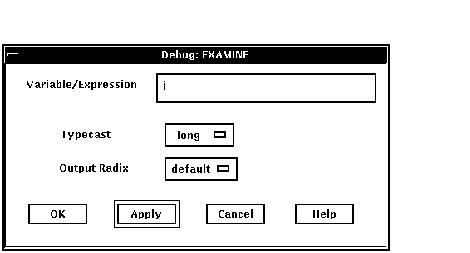
To display the current value in a different type or radix, use the
following alternative method:
- Find and select the variable name in a window as explained in
Section 10.5.1.
- Choose Examine... in the Commands menu in the main window. The
Examine dialog box appears with the name selected in the
Variable/Expression field.
- Choose the default, int, long, quad, short, or char* item from the
Typecast menu within the dialog box.
- Choose the default, hex, octal, decimal, or binary item from the
Output Radix menu within the dialog box.
- Click on OK.
The value, altered to your specification, appears in the command view.
Figure 10-11 shows that the variable j has been typecast as long.
Figure 10-11 Typecasting the Value of a Variable
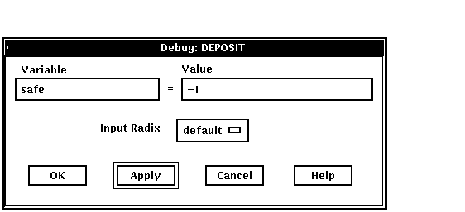
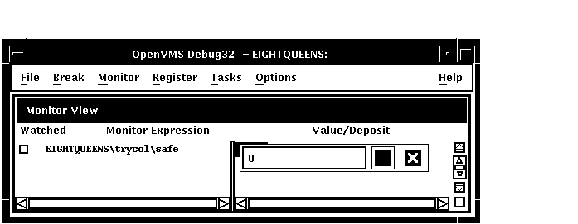
10.5.3 Changing the Current Value of a Variable
To change the current value of a variable:
- Find and select the variable name in a window as explained in
Section 10.5.1.
- Choose Deposit... from the Commands menu in the main window. The
Deposit dialog box appears with the name selected in the Variable field.
- Enter the new value in the Value field.
- Choose the default, hex, octal, decimal, or binary item from the
Input Radix menu within the dialog box.
- Click on OK.
The new value, altered to your specification, appears in the command
view and is assigned to the variable.
Figure 10-12 shows a new value for the variable safe.
Figure 10-12 Changing the Value of a Variable
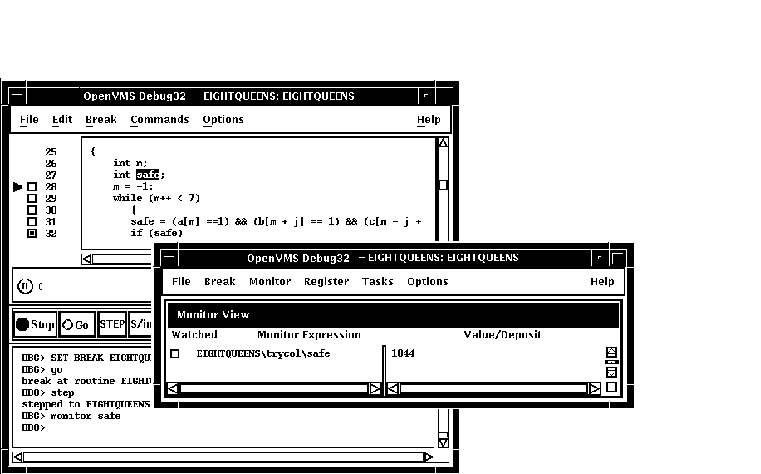
10.5.4 Monitoring a Variable
When you monitor a variable, the debugger displays the value in the
monitor view and checks and updates the displayed value whenever the
debugger regains control from your program (for example, after a step
or at a breakpoint).
Note
You can monitor only a variable, including an aggregate such as an
array or structure (record). You cannot monitor a composite expression
or memory address.
|
To monitor a variable (see Figure 10-13):
- Find and select the variable name in a window as explained in
Section 10.5.1.
- Click on the MON button in the push button view. The debugger:
- Displays the monitor view (if it is not displayed)
- Puts the selected variable's name, along with its qualifying path
name, in the Monitor Expression column
- Puts the value of the variable in the Value/Deposit column
- Puts a cleared button in the Watched column (see Section 10.5.5).
You can typecast the output value when monitoring variables by choosing
the Typecast item in the Monitor menu.
You can change the output radix when monitoring variables as follows:
- Choose Change Radix in the Monitor menu to change the output radix
for a selected monitored element.
- Choose the Change All Radix in the Monitor menu to change the
output radix for all subsequently monitored elements.
To remove a monitored element from the monitor view, choose Remove from
the Monitor menu.
Figure 10-13 Monitoring a Variable
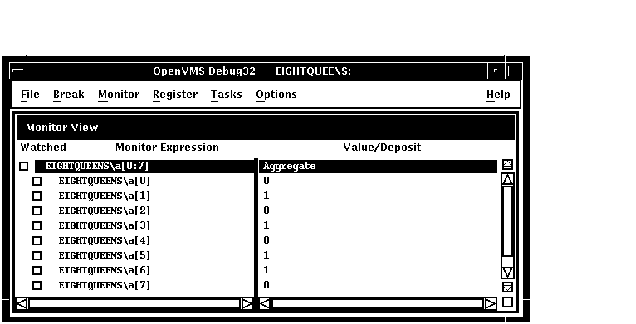
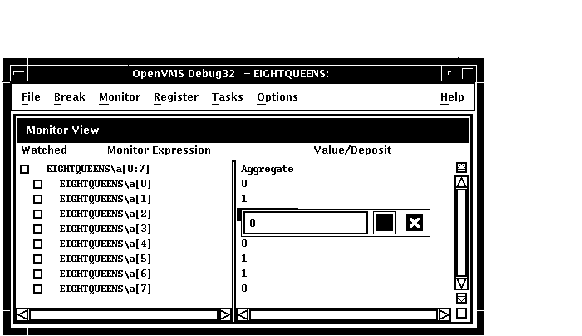
10.5.4.1 Monitoring an Aggregate (Array or Structure) Variable
If you select the name of an aggregate variable, such as an array or
structure (record) and click on the MON button, the debugger displays
the word Aggregate in the Value/Deposit column of the monitor
view. To display the values of all elements (components) of an
aggregate variable, double click on the variable name in the Monitor
Expression column (or choose Expand in the Monitor menu). The displayed
element names are indented relative to the parent name (see
Figure 10-14). If an element is also an aggregate, you can double
click on its name to display its elements, and so on.
Figure 10-14 Expanded Aggregate Variable (Array) in Monitor
View
To collapse an expanded display so that only the aggregate parent name
is shown in the monitor view, double click on the name in the Monitor
Expression column (or choose Collapse from the Monitor menu).
If you have selected a component of an aggregate variable, and the
component expression is itself a variable, the debugger monitors the
component that was active when you made the selection. For example, if
you select the array component
arr[i]
and the current value of
i
is
9
, the debugger monitors
arr[9]
even if the value of
i
subsequently changes to
10
.
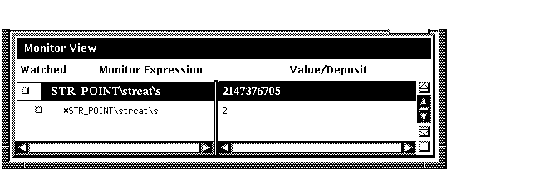
10.5.4.2 Monitoring a Pointer (Access) Variable
If you select the name of a pointer (access) variable and click on the
MON button, the debugger displays the address of the referenced object
in the
Value/Deposit column of the monitor view (see the top entry in
Figure 10-15).
To monitor the value of the referenced object (to dereference the
pointer variable), double click on the pointer name in the Monitor
Expression column. This adds an entry for the referenced object in the
monitor view, indented under the pointer entry (see the bottom entry in
Figure 10-15). If a referenced object is an aggregate, you can double
click on its name to display its elements, and so on.
Figure 10-15 Pointer Variable and Referenced Object in Monitor
View
10.5.5 Watching a Variable
Whenever the program changes the value of a watched variable, the
debugger suspends execution and displays the old and new values in the
command view.
To watch a variable (also known as setting a watchpoint on a variable):
- Monitor the variable as explained in Section 10.5.4. The debugger
puts a button in the Watched column of the monitor view whenever you
monitor a variable. See Figure 10-16.
- Click on the button in the Watched column. A filled-in button
indicates that the watchpoint is set.
Figure 10-16 Watched Variable in Monitor View
To deactivate a watchpoint, clear its Watched button in the monitor
view (by clicking on the button) or choose Toggle Watchpoint in the
Monitor menu. To activate a watchpoint, fill in its Watched button or
choose Toggle Watchpoint in the Monitor menu.
Section 10.6.1 explains static and nonstatic (automatic) variables and
how to access them. The debugger deactivates a nonstatic watchpoint
when execution moves out of (returns from) the variable's defining
routine. When a nonstatic variable is no longer active, its entry is
dimmed in the monitor view and its Watched button is cleared.
The debugger does not automatically reactivate nonstatic watchpoints if
execution later returns to the variable's defining routine. You must
reactivate nonstatic watchpoints explicitly.
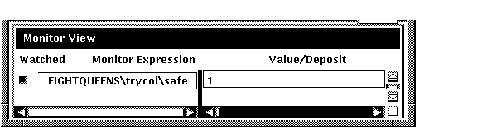
10.5.6 Changing the Value of a Monitored Scalar Variable
To change the value of a scalar (nonaggregate) variable, such as an
integer or Boolean type (see Figure 10-17):
- Monitor the variable as explained in Section 10.5.4.
- Click on the variable's value in the Value/Deposit column of the
monitor view. A small dialog box is displayed over that value, which
you can now edit.
- Enter the new value in the dialog box.
- Click on the check mark (OK) in the dialog box. The dialog box is
removed and replaced by the new value, indicating that the variable now
has that value. The debugger notifies you if you try to enter a value
that is incompatible with the variable's type, range, and so on.
Figure 10-17 Changing the Value of a Monitored Scalar
Variable
To cancel a text entry and dismiss the dialog box, click on X (Cancel).
You can change the value of only one component of an aggregate variable
(such as an array or structure) at a time. To change the value of an
aggregate-variable component (see Figure 10-18):
- Display the value of the component as explained in Section 10.5.4.1.
- Click on the variable's value in the Value/Deposit column of the
monitor view. A small dialog box is displayed over that value, which
you can now edit.
- Enter the new value in the dialog box.
- Click on the check mark (OK) in the dialog box. The dialog box is
removed and replaced by the new value, indicating that the variable now
has that value. The debugger notifies you if you try to enter a value
that is incompatible with the variable's type, range, and so on.
Figure 10-18 Changing the Value of a Component of an Aggregate
Variable
10.6 Accessing Program Variables
This section provides some general information about accessing program
variables while debugging.
If your program was optimized during compilation, you might not have
access to certain variables while debugging. When you compile a program
for debugging, it is best to disable optimization, if possible (see
Section 1.2.1).
Before you check on the value of a variable, always execute the program
beyond the point where the variable is declared and initialized. The
value contained in any uninitialized variable should be considered
invalid.
10.6.1 Accessing Static and Nonstatic (Automatic) Variables
Note
The generic term nonstatic variable is used here to denote what is
called an automatic variable in some languages.
|
A static variable is associated with the same memory address throughout
execution of the program. You can always access a static variable.
A nonstatic variable is allocated on the stack or in a register and has
a value only when its defining routine or block is active (on the call
stack). Therefore, you can access a nonstatic variable only when
program execution is paused within the scope of its defining routine or
block (which includes any routine called by the defining routine).
A common technique for accessing a nonstatic variable is first to set a
breakpoint on the defining routine and then to execute the program to
the breakpoint.
Whenever the execution of your program makes a nonstatic variable
inaccessible, the debugger notifies you as follows:
- If you try to display the value of the variable or monitor the
variable (as explained in Section 10.5.2 and Section 10.5.4,
respectively), the debugger issues a message that the variable is not
active or not in scope.
- If the variable (or an expression that includes the variable) is
currently being monitored, its entry becomes dimmed in the monitor
view. When the entry is dimmed, the debugger does not check or update
the variable's displayed value; also, you cannot change that value as
explained in Section 10.5.3. The entry is fully displayed whenever the
variable becomes accessible again.
- If the variable is currently being watched (as explained in
Section 10.5.5), the watchpoint is deactivated (its Watched button is
cleared) and its entry is dimmed in the monitor view. However, note
that the watchpoint is not reactivated automatically when the variable
becomes accessible again.
10.6.2 Setting the Current Scope Relative to the Call Stack
While debugging a routine in your program, you can set the current
scope to a calling routine (a routine down the stack from the routine
in which execution is currently paused). This enables you to:
- Determine where the current routine call originated
- Determine the value of a variable declared in a calling routine
- Determine the value of a variable during a particular invocation
of a routine that is called recursively
- Change the value of a variable in the context of a routine call
The Call Stack menu on the main window lists the names of the routines
(and, under certain conditions, the images and modules) of your program
that are currently active on the stack, up to the maximum number of
lines that can be displayed on your screen (see Figure 10-19). The
numbers on the left side of the menu indicate the level of each routine
on the stack relative to level 0, which denotes the routine in which
execution is paused.
To set the current scope to a particular routine on the stack, choose
the routine's name from the Call Stack menu (see Figure 10-19). This
causes the following to occur:
- The Call Stack menu, when released, shows the name and relative
level of the routine that is now the current scope.
- The main window shows that routine's source code.
-
The instruction view (if displayed) shows that routine's decoded
instructions.
-
The register view (if displayed) shows the register values associated
with that routine call.
- If the scope is set to a calling routine (a call-stack level other
than 0), the debugger clears the current-location pointer, as shown in
Figure 10-19.
- The debugger sets the scope for symbol searches to the chosen
routine, so that you can examine variables, and so on, in the context
of that scope.
Figure 10-19 Current Scope Set to a Calling Routine
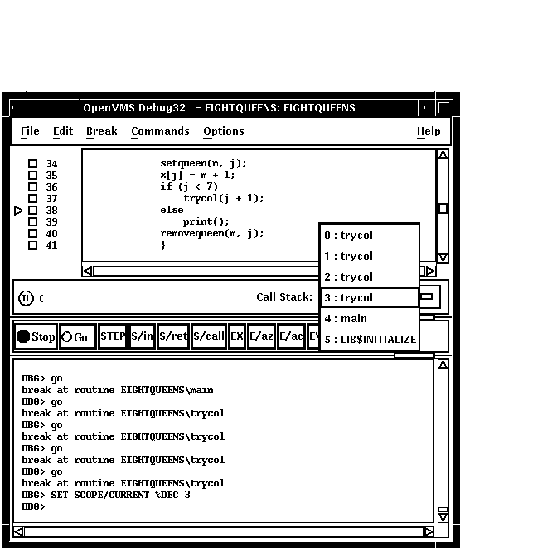
When you set the scope to a calling routine, the current-location
pointer (which is cleared) marks the source line to which execution
will return in that routine. Depending on the source language and
coding style used, this might be the line that contains the call
statement or some subsequent line.
|