| Example 9-1 Command Procedure SEPARATE_WINDOW.COM |
|---|
$ ! Simulates effect of SET MODE SEPARATE from a DECterm window
$ !
$ CREATE/TERMINAL/NOPROCESS -
   /WINDOW_ATTRIBUTES=(TITLE="Debugger",-
           ICON_NAME="Debugger",ROWS=40)-
   /DEFINE_LOGICAL=(TABLE=LNM$JOB,DBG$INPUT,DBG$OUTPUT)
$ ALLOCATE DBG$OUTPUT
$ EXIT
$ !
$ ! The command CREATE/TERMINAL/NOPROCESS creates a DECterm
$ ! window without a process.
$ !
$ ! The /WINDOW_ATTRIBUTES qualifier specifies the window's
$ ! title (Debugger), icon name (Debugger), and the number
$ ! of rows in the window (40).
$ !
$ ! The /DEFINE_LOGICAL qualifier assigns the logical names
$ ! DBG$INPUT and DBG$OUTPUT to the window, so that it becomes
$ ! the debugger input and output device.
$ !
$ ! The command ALLOCATE DBG$OUTPUT causes the separate window
$ ! to remain open when you end the debugging session.
|
$ @SEPARATE_WINDOW %DCL-I-ALLOC, _MYNODE$TWA8: allocated |
A new DECterm window is created with the attributes specified in SEPARATE_WINDOW.COM.
$ DEASSIGN/JOB DBG$INPUT $ DEASSIGN/JOB DBG$OUTPUT |
The debugger window remains open until you close it explicitly.
9.8.3.4 Explanation of DBG$DECW$DISPLAY and DECW$DISPLAY
By default, if your workstation is running HP DECwindows Motif for OpenVMS, the debugger starts up in the HP DECwindows Motif for OpenVMS user interface, which is displayed on the workstation specified by the HP DECwindows Motif for OpenVMS applicationwide logical name DECW$DISPLAY. DECW$DISPLAY is defined in the job table by FileView or DECterm and points to the display device for the workstation.
For information about DECW$DISPLAY, see the description of the DCL commands SET DISPLAY and SHOW DISPLAY in the OpenVMS DCL Dictionary.
The logical name DBG$DECW$DISPLAY is the debugger-specific equivalent of DECW$DISPLAY. DBG$DECW$DISPLAY is similar to the debugger-specific logical names DBG$INPUT and DBG$OUTPUT. These logical names enable you to reassign SYS$INPUT and SYS$OUTPUT, respectively, to specify the device on which debugger input and output are to appear.
The default user interface of the debugger results when DBG$DECW$DISPLAY is undefined or has the same translation as DECW$DISPLAY. By default, DBG$DECW$DISPLAY is undefined.
The algorithm that the debugger follows when using the logical definitions of DECW$DISPLAY and DBG$DECW$DISPLAY is as follows:
- If the logical name DBG$DECW$DISPLAY is defined, then use it. Otherwise, use the logical name DECW$DISPLAY.
- Translate the logical name. If its value is not null (if the string contains characters other than spaces), the HP DECwindows Motif for OpenVMS user interface is displayed on the specified workstation. If the value is null (if the string consists only of spaces), the command interface is displayed in the DECterm window.
To enable the OpenVMS Debugger to start up in the HP DECwindows Motif for OpenVMS user interface, first enter one of the following DCL commands:
$DEFINE DBG$DECW$DISPLAY "WSNAME::0" $SET DISPLAY/CREATE/NODE=WSNAME |
where WSNAME is the nodename of your workstation.
9.9 Starting the Motif Debug Client
The OpenVMS Debugger Version 7.2 features a client/server interface
that allows you to debug programs running on OpenVMS on a VAX or Alpha
CPU from a client interface running on the same or separate system.
The debugger client/server retains the functionality of the kept
debugger, but splits the debugger into two components: the debug server
and the debug client. The debug server runs on an OpenVMS system, and
is just like the kept debugger without the user interface. The debug
client contains the user interface, and runs on an OpenVMS system using
HP DECwindows Motif for OpenVMS, or on a PC running Microsoft Windows 95 or Microsoft
Windows NT.
9.9.1 Software Requirements
The debug server requires OpenVMS Version 7.2 or later.
The debug client can run on any of the following:
- OpenVMS Version 7.2 or later, along with HP DECwindows Motif for OpenVMS Version 1.2-4
- Microsoft Windows 95
- Microsoft Windows NT Version 3.51 or later (Intel or Alpha)
The OpenVMS Debugger client/server configuration also requires that the following be installed on the OpenVMS node running the server:
- A TCP/IP stack
- DCE RPC
If you are running TCP/IP Services for OpenVMS (UCX) Version 4.1, you must have ECO2 installed. You can also run a later version of UCX. The OpenVMS Version 7.2 installation procedures automatically install DCE RPC. |
9.9.2 Starting the Server
You can start the debug server after logging in directly to the OpenVMS system, or you may find it more convenient to log in remotely with a product such as eXcursion, or an emulator such as Telnet.
To start the debug server, enter the following command:
$ DEBUG/SERVER |
The server displays its network binding strings. The server port number is enclosed in square brackets ([]). For example:
$ DEBUG/SERVER %DEBUG-I-SPEAK: TCP/IP: YES, DECnet: YES, UDP: YES %DEBUG-I-WATCH: Network Binding: ncacn_ip_tcp:16.32.16.138[1034] %DEBUG-I-WATCH: Network Binding: ncacn_dnet_nsp:19.10[RPC224002690001] %DEBUG-I-WATCH: Network Binding: ncadg_ip_udp:16.32.16.138[1045] %DEBUG-I-AWAIT: Ready for client connection... |
Use one of the network binding strings to identify this server when you connect from the client (see Section 9.9.4). The following table matches the network binding string prefix with its associated network transport:
| Network Transport | Network Binding String Prefix |
|---|---|
| TCP/IP | ncacn_ip_tcp |
| DECnet | ncacn_dnet_nsp |
| UDP | ncadg_ip_udp |
You can usually identify the server using only the node name and the port number. For example, nodnam[1034] . Messages and program output appear by default in the window in which you start the server. You can redirect program output to another window as required. |
The following example contains an error message that indicates that DCE is not installed:
$ debug/server %LIB-E-ACTIMAGE, error activating image disk:[SYSn.SYSCOMMON.][SYSLIB]DTSS$SHR.EXE; -RMS-E-FNF, file not found |
This indicates that DCE is installed but not configured.
9.9.3 Primary Clients and Secondary Clients
The debugger client/server interface allows more than one client to be connected to the same server. This allows team debugging, classroom sessions, and other applications.
The primary client is the first client to connect to the server. A secondary client is an additional client that has connected to the same server. The primary client controls whether or not any secondary clients can connect to the server.
Section 9.9.4 describes how to specify the number of secondary clients
allowed in a session.
9.9.4 Starting the Motif Client
A session is the connection between a particular client and a particular server. Each session is identified within the client by the network binding string the client used to connect to the server. Once the debug server is running, start the Motif debug client. To do so, enter the following command:
$ DEBUG/CLIENT |
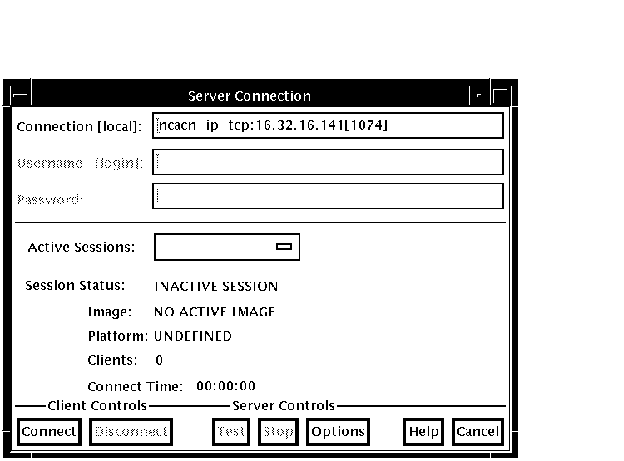
To establish a session from the Motif debug client, click on Server Connection from the File menu. The Server Connection dialog displays, in the Connection list, the default network binding string. This string is based on the last string you entered, or the node on which the client is running. There is not necessarily a server associated with the default binding string. Figure 9-6 shows the Server Connection dialog.
Figure 9-6 Debug Server Connection Dialog

From the buttons at the bottom of the Server Connection dialog, you can
- Connect to the selected server to begin and activate a new session
- Disconnect from a session
- Test whether the session is still available
- Stop the server
- Cancel the connection operation and dismiss the dialog
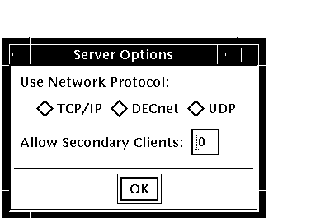
In addition, the Options button invokes the Server Options dialog, which allows you to select the network transport to be used (see Section 11.5.1).
The Server Options dialog also allows you to select the number of secondary clients (0-31) allowed for a new session.
Figure 9-7 shows the Server Options dialog.
Figure 9-7 Server Options Dialog

To connect the client to a server, perform the following steps:
- Open the File menu.
- Click Server Connection.
- Enter the server network binding string in the Connection field, or select the default string.
- Click Options.
- In the Server Options dialog, click on the network transport: TCP/IP, DECnet, or UDP.
- In the Server Options dialog. select the number of secondary clients (0-31) to be allowed.
- Click OK to dismiss the Server Options dialog.
- In the Server Connection dialog, click Connect.
You can establish connections to an unlimited number of servers by
repeating the sequence above and specifying the new network binding
string each time.
9.9.5 Switching Between Sessions
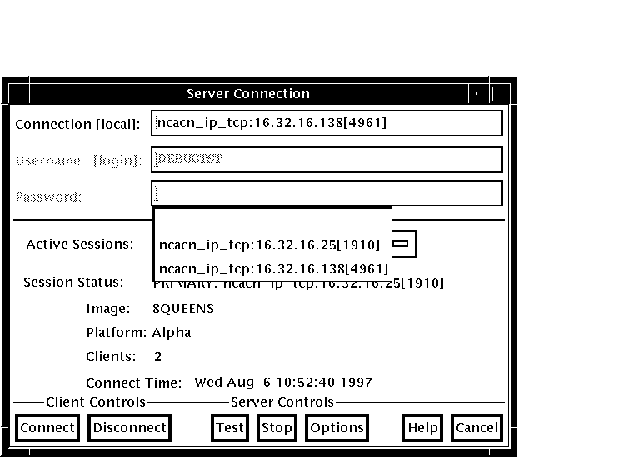
Each time you connect to a server and initiate a session, the session is listed in the Active Sessions list in the Server Connection dialog (see Figure 9-8). You can switch back and forth between sessions. Each time you switch to a new session, the debugger updates the contents of any open debugger displays with the new context.
To switch to a different session, perform the following steps:
- Open the File menu.
- Click Server Connection.
- Click the Active Sessions list to display the list of active sessions.
- Double click the required session in the Active Sessions list. This selects the session as the current session, dismisses the Server Connection dialog, and updates the debugger displays with the current context.
Note that you cannot change the number of secondary clients allowed on a session while that session is active. To change the number of clients allowed on a session, you must be the primary client, and perform the following steps:
- Open the File menu.
- Specify the network binding string of the session.
- Click Disconnect.
- Click Options.
- In the Server Options dialog, click on the network transport: TCP/IP, DECnet, or UDP.
- In the Server Options dialog, select the number of secondary clients (0-31) to be allowed.
- Click OK to dismiss the Server Options dialog.
- In the Server Connection dialog, click Connect.
Figure 9-8 Active Sessions List

9.9.6 Closing a Client/Server Session
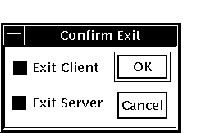
Click on Exit Debug? on the File menu to invoke the Confirm Exit dialog. Figure 9-9 shows the Confirm Exit dialog.
Figure 9-9 Confirm Exit Dialog

Once you have invoked the Confirm Exit dialog, perform one of the following:
- To terminate both the client and the server (default) click OK.
- To dismiss the Confirm Exit dialog without taking any action, click Cancel.
- To terminate only the debug client, perform the following steps:
- Click Exit Server.
- Click OK.
- To terminate only the debug server, perform the following steps:
- Click Exit Client.
- Click OK.
If you do not terminate the debug server, you can connect to the server from another debug client. If you do not terminate the client, you can connect to another server for which you know the network binding string.
| Previous | Next | Contents | Index |