| Previous | Contents | Index |
This chapter explains how to:
The chapter describes window actions and window menu choices, but you can perform most common debugger operations by choosing items from context-sensitive pop-up menus. To access these menus, click MB3 while the mouse pointer is in the window area.
You can also enter commands at the HP DECwindows Motif for OpenVMS command prompt. For information about entering debugger commands, see Section 8.3.
For the source code of programs EIGHTQUEENS.EXE and 8QUEENS.EXE, shown
in the figures of this chapter, see Appendix D.
10.1 Displaying the Source Code of Your Program
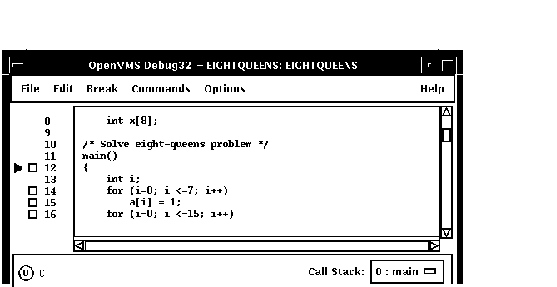
The debugger displays the source code of your program in the main window (see Figure 10-1).
Figure 10-1 Source Display

Whenever execution is suspended (for example, at a breakpoint), the debugger updates the source display by displaying the code surrounding the point at which execution is paused. The current-location pointer, to the left of the source code, marks which line of code will execute next. (A source line corresponds to one or more programming-language statements, depending on the language and coding style.)
By default, the debugger displays compiler-generated line numbers to the left of the source code. These numbers help identify breakpoints, which are listed in the breakpoint view (see Section 10.4.4). You can choose not to display line numbers so that more of the source code can show in the window. To hide or display line numbers, toggle Display Line Numbers from the File menu on the main window.
The Call Stack menu, between the source view and the push button view, shows the name of the routine whose source code is displayed.
The current-location pointer is normally filled in as shown in Figure 10-1. It is cleared if the displayed code is not that of the routine in which execution is paused (see Section 10.1.3 and Section 10.6.2).
You can use the scroll bars to show more of the source code. However, you can scroll vertically through only one module of your program at a time. (A module corresponds generally to a compilation unit. With many programming languages, a module corresponds to the contents of a source file. With some languages, such as Ada, a source file might contain one or more modules.)
The following sections explain how to display source code for other parts of your program so that you can set breakpoints in various modules, and so on. Section 10.1.3 explains what to do if the debugger cannot find source code for display. Section 10.6.2 explains how to display the source code associated with routines that are currently active on the call stack.
After navigating the main window, you can redisplay the location at which execution is paused by clicking on the Call Stack menu.
If your program was optimized during compilation, the source code
displayed might not reflect the actual contents of some program
locations
(see Section 1.2).
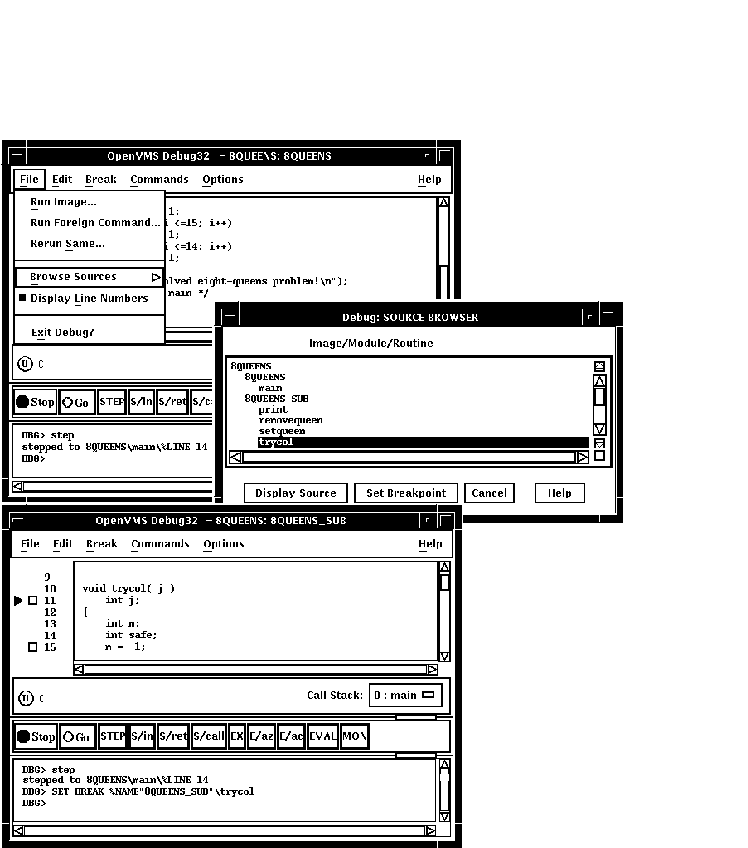
10.1.1 Displaying the Source Code of Another Routine
To display source code of another routine:
Section 10.6.2 describes an alternative way to display routine source code for routines currently active on the call stack.
Figure 10-2 Displaying Source Code of Another Routine

10.1.2 Displaying the Source Code of Another Module
To display source code of another module:
In certain cases, the debugger cannot display source code. Possible causes are:
If the debugger cannot find source code for display, it tries to
display the source code for the next routine down on the call stack for
which source code is available. If the debugger can display source code
for such a routine, the current-location pointer is moved to point to
the source line to which execution returns in the calling routine.
10.1.4 Specifying the Location of Source Files
Information about the characteristics and the location of source files
is embedded in the debug symbol table of your program. If a source file
has been moved to a different directory since compile time, the
debugger might not find the file. To direct the debugger to your source
files, use the SET SOURCE command at the DBG> prompt (see
Section 6.2).
10.2 Editing Your Program
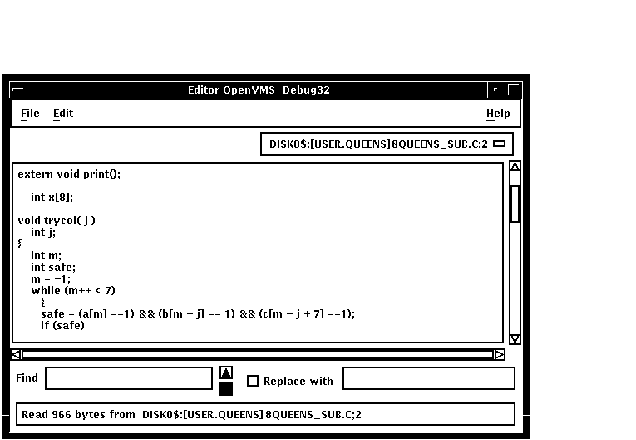
The debugger provides a simple text editor you can use to edit your source files while debugging your program (see Figure 10-3).
The text editor available through the debugger's HP DECwindows Motif for OpenVMS menu interface is a simple convenience feature, not intended to replace sophisticated text editors such as the Language-Sensitive Editor (LSE). You cannot substitute a more sophisticated editor for the text editor invoked with the Edit File item in the Commands menu. To use a different editor, enter the EDIT command at the DBG> prompt in the command view (see EDIT in the Command Reference Dictionary of this manual).
Figure 10-3 Editor Window

To invoke the editor, choose the Edit File item in the Commands menu on the main window. By default, the editor opens a buffer and displays the module currently displayed in the source view. The buffer is named with the file specification of the file in the buffer. If no file is displayed in the source view, the editor displays an empty text buffer, called main_buffer. The buffer name appears in the buffer menu, which is just under the menu bar of the editor view.
The editor allows you to create any number of text buffers by choosing New (for empty text buffers) or Open (for existing files) from the File menu. The name of each text buffer appears in the buffer menu. You can cut, copy, and paste text from buffer to buffer by choosing items from the Edit menu and selecting buffers from the buffer menu.
You can perform forward and backward search and replace operations by entering strings in the Find and Replace with fields and clicking on a directional arrow. You can perform a repeated search for the string by continuing to press the Return key. You can also continue a search by choosing the Find/Replace Next or Find/Replace Previous items in the Edit menu.
To save the file, choose the Save or Save As... items from the File menu. If you do not save your corrections before closing a modified buffer or exiting the debugger, the debugger displays a warning message.
To test any changes to the source code:
This section explains how to:
For information about rerunning your program or running another program
from the current debugging session, see Section 9.3 and Section 9.4.
10.3.1 Determining Where Execution Is Currently Paused
To determine where execution is currently paused within your program:
To list the sequence of routine calls that are currently active on the
call stack, click on the Call Stack menu. Level 0 denotes the routine
in which execution is paused, level 1 denotes the calling routine, and
so on.
10.3.2 Starting or Resuming Program Execution
To start program execution or resume execution from the current location, click on the Go button in the push button view (see Figure 8-3).
Letting your program run freely without debugger intervention is useful in situations such as the following:
Once started, program execution continues until one of the following events occurs:
Whenever the debugger suspends execution of the program, the main
window display is updated and the current-location pointer marks which
line of code will execute next.
10.3.3 Executing Your Program One Source Line at a Time
To execute one source line of your program, click on the STEP button in the push button view or enter the STEP command in the command view. This debugging technique (called stepping) is one of the most commonly used.
After the line executes, the source view is updated and the current-location pointer marks which line of code will execute next.
Note the following points about source lines and the stepping behavior:
Keep in mind that if you optimized your code at compilation time, the
source code displayed might not reflect the code that is actually
executing (see Section 1.2).
10.3.4 Stepping into a Called Routine
When program execution is paused at a routine call statement, clicking on the STEP button typically executes the called routine in one step (depending on the coding style used), and the debugger suspends execution at the next source line in the calling routine (assuming no breakpoint was set within the called routine). This enables you to step through the code quickly without having to trace execution through any called routines (some of which might be system or library routines). This is called stepping over called routines.
To step into a called routine so that you can execute it one line at a time:
Once execution is within the called routine, click on the STEP button to execute the routine line by line.
Clicking on the S/in button when execution is not paused at a routine
call statement is the same as clicking on the STEP button.
10.3.5 Returning from a Called Routine
When execution is suspended within a called routine, you can execute your program directly to the end of that routine by clicking on the S/ret button in the push button view, or enter the STEP/RETURN command at the DBG> prompt.
The debugger suspends execution just before the routine's return instruction executes. At that point, the routine's call frame has not been deleted from the call stack, so you can still get the values of variables local to that routine, and so on.
You can also use the S/call button in the push button view (or enter the STEP/CALL command at the DBG> prompt) to execute the program directly to the next Return or Call instruction.
The S/ret button is particularly useful if you have inadvertently
stepped into a system or library routine (see Section 10.1.3).
10.4 Suspending Execution by Setting Breakpoints
A breakpoint is a location in your program at which you want execution to stop so that you can check the current value of a variable, step into a routine, and so on.
When using the debugger's HP DECwindows Motif for OpenVMS user interface, you can set breakpoints on:
If you are stopped at a breakpoint in a routine that has control of the mouse pointer by a PointerGrab or a KeyboardGrab, your workstation will hang. To work around this problem, debug your program using two workstations. For more information, see Section 9.8.3.1. |
The debugger provides two ways to qualify breakpoints:
You can set a breakpoint that is both a conditional and action breakpoint.
The following sections explain these breakpoint options.
10.4.1 Setting Breakpoints on Source Lines
You can set a breakpoint on any source line that has a button to its left in the source display. These are the lines for which the compiler has generated executable code (routine declarations, assignment statements, and so on).
To set a breakpoint on a source line:
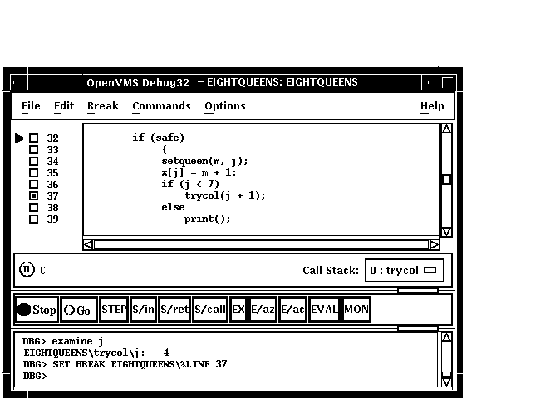
Figure 10-4 shows that a breakpoint has been set on the start of line 37.
Figure 10-4 Setting a Breakpoint on a Source Line

Setting a breakpoint on a routine enables you to move execution directly to the routine and inspect the local environment.
To set a breakpoint on a routine:
Figure 10-5 Setting a Breakpoint on a Routine

An exception breakpoint suspends execution when an exception is signaled and before any exception handler declared by your program executes. This enables you to step into the exception handler (if one is available) to check the flow of control.
To set an exception breakpoint, choose On Exception from the Break menu
on the main window or the optional views window.
10.4.4 Identifying the Currently Set Breakpoints
There are three ways to determine which breakpoints are currently set:
| Previous | Next | Contents | Index |