| Previous | Contents | Index |
Although applications need not be directly concerned about shadowing matters, certain points must be considered when implementing performance boosting optimizations:
For more information on designing applications, see the Tolerating Site
Disaster section in the Reliable Transaction Router Application Design Guide.
5.8 Server States
The current state of a server can be examined using the SHOW SERVER/FULL command. For example,
RTR> show server/full Servers: Process-id: 13340 Facility: RTR$DEFAULT_FACILITY Channel: 131073 Flags: SRV State: active(1) Low Bound: High Bound: 87 13 rcpnam: "RTR$DEFAULT_CHANNEL" User Events: 0 RTR Events: 0 Partition-Id: 16777216 Process-id: 13340 Facility: RTR$DEFAULT_FACILITY Channel: 196610 Flags: SRV State: active Low Bound: 88 13 High Bound: 0f' rcpnam: "CHAN2" User Events: 0 RTR Events: 0 Partition-Id: 16777217 |
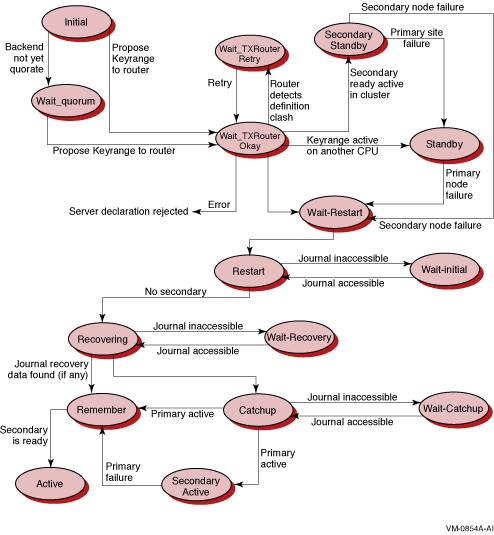
Figure 5-1 shows the backend server states that can occur and that appear in the State: field.
Figure 5-1 Backend Server States

The current state of a client process can be examined using the SHOW CLIENT/FULL command. For example,
RTR> show client/full Clients: Process-id: 13340 Facility: RTR$DEFAULT_FACILITY Channel: 458755 Flags: CLI State: declared(1) rcpnam: "CHAN3" User Events: 255 RTR Events: 0 |
Figure 5-2 shows the client states that can occur and that appear in the State: field.
Figure 5-2 Frontend Client States

5.10 Partition States
The current state of a partition can be examined using the SHOW
PARTITION/FULL command on the routers and the backends. Using the
/ROUTER qualifier shows the states as seen from the routers, and using
the /BACKEND qualifier shows the states as seen from the backends.
Router partitions:
RTR> show partition/router/full Facility: RTR$DEFAULT_FACILITY State: ACTIVE(1) Low Bound: 0 High Bound: 4294967295 Failover policy: fail_to_standby Backends: node10 States: active(2) Primary Main: node10 Shadow Main: |
Backend partitions:
RTR> show partition/backend/full Partition name: RTR$DEFAULT_PARTITION_16777217 Facility: RTR$DEFAULT_FACILITY State: active(1) Low Bound: "aaaa" High Bound: "mmmm"(2) Active Servers: 0 Free Servers: 1(3) Transaction presentation: active Last Rcvy BE: Txns Active: 0 Txns Rcvrd: 0 Failover policy: fail_to_standby Key range ID: 16777217(4) Partition name: RTR$DEFAULT_PARTITION_16777218 Facility: RTR$DEFAULT_FACILITY State: active Low Bound: "nnnn" High Bound: "zzzz" Active Servers: 0 Free Servers: 1 Transaction presentation: active Last Rcvy BE: Txns Active: 0 Txns Rcvrd: 0 Failover policy: fail_to_standby Key range ID: 16777218 |
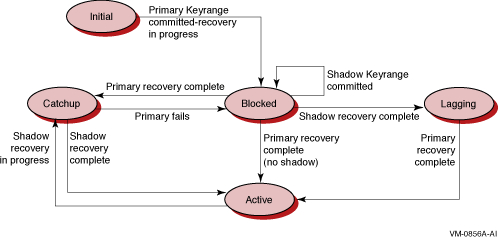
Figure 5-3 shows the partition states that can occur and that appear in the State: field.
Figure 5-3 Router Partition States

This chapter contains information useful for analyzing performance aspects of RTR, especially in large configurations.
To manage remote nodes, you must have either proxy accounts or rsh access to them. Use RTR remote commands to manage remote nodes.
You should also add and grant operator privileges to the accounts used
to manage the RTR network.
6.1 RTR Monitor Pictures
RTR supplies many monitor pictures to help you troubleshoot your application. To display a monitor picture, use the following command at the RTR prompt:
RTR> MONITOR picture-name |
The following table provides suggested monitor pictures to display when you encounter problems:
| For this type of failure: | Use these monitor pictures: |
|---|---|
| Most common problems | SYSTEM |
| Connection failures | ACCFAIL, CONNECTS, FRONTEND, LINK, NETSTAT, STALLS |
| Transaction sequence problems | CALLS |
| Channel problems | CALLS, CHANNEL, PARTIT |
| Quorum problems | QUORUM, ROLEQUOR |
| V2 interface API | V2CALLS |
| Journal problems | JCALLS, JOURNAL |
| API problems | APP2ACP, ACP2APP, REJECTS, REJHIST, ROUTERS |
| XA interface problems | XA |
| Application Problems | APP2ACP, ACP2APP, CALLS, CHANNEL, PARTIT, REJECTS, REJHIST, ROUTERS |
See Chapter 7 for descriptions and examples of the monitor
pictures, and Chapter 8 for the full syntax of the MONITOR command.
6.2 Enabling RTR Logging
Many problems can be better analyzed when RTR logging has been enabled.
RTR logging output can be directed to a file, for example, on RTR startup.
$ RTR SET LOG /FILE=logfile.dat
|
You should monitor the size of the log file; archive and purge as
necessary.
6.3 Starting a Facility
When a facility is started or restarted and servers are declared, RTR recovery features require that it searches journal files of backend nodes in the facility. This allows recovery of any incomplete transactions that were in-flight when the facility last existed. However, if some of the facility's recovery information exists on a backend that is not available at startup, RTR waits for access to the journal on that backend and thus appears to "hang".
This situation can be detected by using MONITOR RECOVERY; backend nodes will be waiting for access to recovery journals. If this is the case, you may follow one of these procedures to continue the startup:
This section provides guidance for System Managers who are analyzing an RTR application that is not functioning correctly.
If an application using RTR hangs, use the following checklist to analyze the situation.
    $ RTR SHOW RTR

    RTR running on node MYNODE in SYSTEM mode
|
$ RTR SHOW PROCESS
|
$ RTR SHOW FACILITY /LINK
|
Analyze the reasons why the server crashed before you restart the
server. Failures that cascade could present a problem, but note that
doing a restart will prevent failover.
6.6 Link Connect Failures
The following table explains the meaning of link connect failure codes:
| Code | Text | Implications |
|---|---|---|
| NOTRECOGNISED | Node not recognized | Remote node that received the connection request does not have the local node in its RTR configuration. |
| REFUSED | Connection refused | Indicates one of the following conditions on the remote system: either RTR is not running, or a requested network protocol is not installed. |
| FACNOTDEC | Facility not declared | The requested facility is not configured on the remote node. |
| NODENOTCFG | Node not configured | The remote node has the local node in its configuration, though not as part of the requested facility. |
| ROLESMISMATCH | Roles mismatch | The remote node has the local node configured in the requested facility, but in a role other than the one requested. |
Any of the above errors can occur as the result of the connection request arriving at the wrong node for any of the following reasons:
The following table explains the meaning of rejected transaction codes:
| Code | Text | Implications |
|---|---|---|
| NODSTFND | No destination found | Primary and all alternate servers for a partition cannot be reached by the client application. This situation can be caused by network problems or services which have not been started or have crashed. |
| JNLFULL | Journal full | May occur when the RTR journal is full. Note that RTR reserves a percentage of the journal to ensure that in-progress transactions can be completed. The JNLFULL error is most likely to be seen with shadow servers running in remember mode, but can also be caused by many transactions being queued to an unresponsive server. |
| DLKTXRES | Deadlock detected transaction rescheduled | May occur during the commit cycle for multi-participant transactions or in extreme failover situations when the order of transactions must be corrected. This reject reason indicates that two transactions were interfering with each other. RTR rejects one branch of the offending transactions to clear the deadlock. Since this transaction branch is subsequently rescheduled by RTR, this reject can be considered informational. |
| TIMEOUT | Time out | Occurs if the rtr_send_to_server timeout provided by the client application expires. This reject indicates poor responsiveness by the service. |
Certain difficulties can be more easily investigated if a snapshot of the problem node is made. Make a snapshot if the application hangs, causes delays, or seems to be causing other problems.
OpenVMS
On OpenVMS systems, a snapshot is made by executing a command file:
$ @SYS$MANAGER:RTR$SNAPSHOT.COM |
The output is a file named nodename _RTR_DIAGS.TMP.
Information in this file can help to determine the possible causes of a fault (OpenVMS, DECnet, RTR, environment, database, application, and so on.) The information includes numerous RTR monitor pictures, executable image versions, process states, and so on.
UNIX
On UNIX systems, make a snapshot by entering the following command on the problem node:
# rtr_snapshot.sh |
The information displayed on the screen includes many RTR monitor pictures, executable image versions, process states, and other information.
Windows
To take a snapshot on Windows, click on the Snapshot icon on the RTR
menu. A DOS-style window with the title "Snapshot" appears as
the snapshot is taken. The file
rtr_snapshot.log
is created in the directory where RTR runs, for example,
C:\Program Files\HP\RTR . You can read this file with an editor such as
Notepad.
If using Microsoft Windows Scripting Host, the minimum version is 5.6 for use with RTR. With an earlier version of the Scripting Host, RTR snapshot will run with reduced functionality. To obtain the latest Scripting Host software, use the Microsoft download center at http://msdn.microsoft.com/downloads . |
Sun
To take a snapshot on Sun, use
fssnap
. This copies the original filesystem blocks into a file as they are
changed, with some performance degradation.
6.9 Generating a Process Dump
OpenVMS Systems
Certain potential difficulties can be more easily investigated by RTR Support if a dump of the RTR ACP is available. It shows diagnostics generated if unhandled exceptions occur.
The file SYS$MANAGER:RTR$STARTUP.COM can be altered to include the definition of the logical name RTR$DUMP_DIRECTORY which specifies the device and directory where the dump is to be generated.
Since an RTR dump file typically uses about 5000 blocks, enough space should be available on the chosen disk. For a very large node installation, or a large number of links, the dump file may be up to 20,000 blocks.
To prepare for dump creation, make sure that:
An RTR ACP dump can be created as follows:
    $ RTR
    RTR> SET MODE /UNSUPPORTED
    RTR> DEBUG ACP
    ^G
    RTR> SET MODE /NOUNSUPPORTED
    ^Z
    $
|
Unsupported commands should be used with care.
UNIX Systems
UNIX core files are generated with no special configuration, but their name and location may vary depending on operating system settings and how RTR is started up. The file rtr_error*.log is usually created in /rtr .
Windows Systems
On Windows systems, a process dump file can be generated by enabling the Dr. Watson post-mortem crash analyzer. This is done by entering the MS-DOS command:
(%WINDIR%\drwtsn32 -i) |
The files created are %WINDIR%\DRWTSN32.LOG and %WINDIR%\USER.DMP.
These files should be included with any problem report submitted to RTR Engineering in the event of an RTR crash, along with the RTR dump file (RTR_<n>.DMP) and the RTR log file. The file rtr_error*.log is also created. Send in *.log files when reporting an error, if running RTR with logging in use.
| Previous | Next | Contents | Index |