HP OpenVMS Systems Documentation |
Compaq Availability Manager User's Guide
1.3.2 Posting EventsThe Availability Manager evaluates each data collection for events. The Availability Manager posts events when data values in a data collection meet or exceed user-defined thresholds and occurrences. Values for thresholds and occurrences are displayed on Event Customization pages similar to the one shown in Figure 1-6. Thresholds and occurrences are described in the next section. Figure 1-6 Sample Event Customization Page 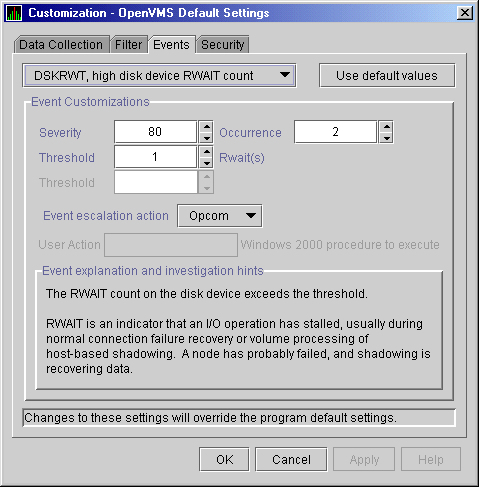
1.3.2.1 Thresholds and OccurrencesThresholds and occurrences are criteria that the Availability Manager uses for posting events. A threshold is a value against which data in a data collection is compared. An occurrence is a value that represents the number of consecutive data collections that meet or exceed the threshold. Both thresholds and occurrences are customizable values that you can adjust according to the needs of your system. For details about how to change the values for thresholds and occurrences, see Chapter 7.
Relationship between Thresholds and Occurrences
For a particular event, when the data collected meets or exceeds the threshold, the data collection enters a threshold-exceeded state. When the number of consecutive data collections to enter this state meets or exceeds the value in the Occurrence box (see Figure 1-6), the Availability Manager displays (posts) the event in the Event pane. A closer look at Figure 1-6 shows the relationship between thresholds and occurrences. For the DSKRWT, high disk device RWAIT count event, a threshold of 1 Rwait process has been set. A value of 2 in the Occurrence box indicates that the number of Rwait errors during 2 consecutive data collections must meet or exceed the threshold of 1 for the DSKRWT, high disk device RWAIT count event to be posted.
The following sections explain these security methods further.
Figure 1-7 illustrates how you can use passwords to limit access to node information. The Testing Department's Data Analyzer, whose password is HOMERUNS, can access only OpenVMS Data Collector nodes with the HOMERUNS password as part of their security triplets. The same is true of the Accounting Department Data Analyzer, whose password is BATTERUP; it can access only OpenVMS Data Collector nodes with the BATTERUP password as part of their security triplets. Figure 1-7 Availability Manager Password Matching 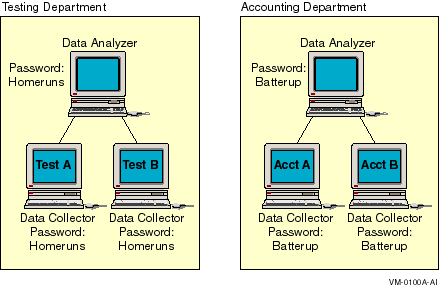
The Availability Manager sets a default password when you install the Data Analyzer. To change that password, you must use a customization option that is explained in Chapter 7.
Chapter 2
|
Before you start this chapter, be sure to read the explanation of data collection, events, thresholds, and occurrences in Chapter 1. When this manual does not use the terms Windows 2000 or Windows XP, the term "Windows" refers to both Windows 2000 and XP, but not to any other Windows product. |
This chapter provides the following information:
For information about installing the Availability Manager on OpenVMS or Windows systems, refer to the appropriate installation instructions. You can access these instructions from the Availability Manager web pages at the following URL:
http://www.openvms.compaq.com/openvms/products/availman/ |
The installation instructions for OpenVMS systems also include an explanation of how to install and use both DECamds and the Availability Manager on the same system.
2.1 Starting the Data Collector
Beginning with OpenVMS Version 7.2, the files needed to run the Data
Collector on OpenVMS nodes are shipped with the OpenVMS operating
system. However, if you want the latest Data Collector software, you
need to install it from the Availability Manager Version 2.2 kit.
Once the Data Collector is running on a node, you can monitor that node
using DECamds or the Availability Manager.
To use the Data Collector on a particular node, do either of the following:
$ @SYS$STARTUP:AMDS$STARTUP START
|
@SYS$STARTUP:AMDS$STARTUP START
|
This section describes what you need to do after the Availability Manager Data Analyzer is installed. Starting the Data Analyzer is somewhat different on OpenVMS and on Windows systems. However, on both systems, starting the Data Analyzer automatically starts the Java graphical user interface (GUI) that allows you to view information that is collected from the Data Collector nodes.
The following sections contain the sequence of steps required to start
the Data Analyzer on an OpenVMS node and a Windows node.
2.2.1 How to Start the Data Analyzer on an OpenVMS Alpha Node
Make sure the Data Analyzer has been installed on the OpenVMS Alpha node from which you want to monitor other nodes. (Installation instructions are at the web site referred to at the beginning of this chapter.)
To start the Data Analyzer, enter the following command:
$ avail/avail |
The Availability Manager then displays the main Application window, which is shown in Figure 2-1.
Refer to the Installation Instructions for qualifiers you can use with
the AVAIL/AVAIL command.
2.2.2 How to Start the Data Analyzer on a Windows Node
Make sure the Data Analyzer has been installed on the Windows node from which you want to monitor other nodes. (Installation instructions are at the web site referred to at the beginning of this chapter.)
To start the Data Analyzer, follow these steps:
The Availability Manager then displays the main Application window, which is
shown in Figure 2-1.
2.3 Using the Application Window
Once it starts, the Availability Manager watches for notifications from nodes running the Data Collector. After receiving notification from the Data Collector, the Availability Manager attempts to connect to a node. This is called the attempting collection phase.
If the node passes the security check while the Availability Manager is attempting the connection, the connection succeeds, and data collection starts. This is called the data collection phase. If the node fails the security check, it is in the connection failed phase.
While collecting data, if a node goes down, or a network connection fails between the graphical user interface and the node, that node is placed in the path lost phase.
The Availability Manager notifies you of these phases and other states in the Application window, which is shown in Figure 2-1.
Figure 2-1 Application Window
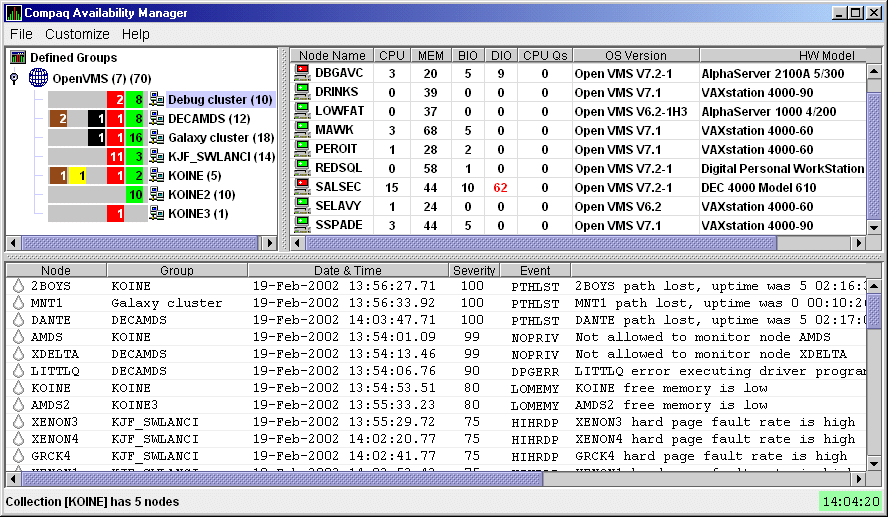
The Application window is divided into three segments, or panes:
| Column Number | Color | Description |
|---|---|---|
| 1 | Brown | Number of nodes for which attempts to configure the node have failed---for example, because the node is in a connection failed phase. |
| 2 | Yellow | Number of nodes that are in the attempting collection phase. |
| 3 | Black | Number of nodes that are in a path lost phase. |
| 4 | Red | Number of nodes that are in the data collection phase but that have exceeded a threshold, thereby causing an event to be posted. |
| 5 | Green | Number of nodes that are in the data collection phase. |
You can change the size of the panes as well as the width of specific fields in the Application window and also the borders between the fields by clicking on a border and dragging it. Scroll bars indicate whether you are displaying all or part of a screen. For example, clicking a right arrow on a scroll bar allows you to view the rightmost portion of a screen.
2.3.1 Other Window Components
In addition to panes, the Application window also includes the
following components (see Figure 2-1):
The title bar runs across the top of the window and contains the product name.
The menu bar, immediately below the title bar, contains the following menu options:
The status bar runs across the bottom of the window. It displays the
name of the selected group and the number of nodes in that group.
2.3.2 Displaying More Information
In the initial Application window (Figure 2-1), which is displayed by default, you can do the following at any time:
When you start the Availability Manager, the Group pane lists groups of nodes that the Data Analyzer has found. If the Data Analyzer finds Windows nodes, those are also displayed.
To monitor specific nodes, you must select the group in the Group pane that contains those nodes (see Figure 2-2).
Figure 2-2 Group Pane
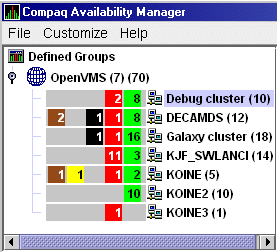
Groups are set up during installation on Data Collector nodes and are user definable. You might define groups by function, type of hardware, or geographical location.
For example, if you were to set up groups of nodes by geographical location, you might assign nodes A and B to a group called Dallas and nodes C, D, and E to a group called Denver. When you select a group, the Availability Manager displays only the nodes in that group, as shown in the following table:
| Group Selected | Nodes Displayed |
|---|---|
| Dallas |
Node A
Node B |
| Denver |
Node C
Node D Node E |
By default, all nodes are members of one group, DECAMDS, when your system is set up. If you want to change the groups being monitored, you need to to use a customization option to make changes. See Section 7.1 for instructions.
Compaq recommends that you define a cluster as its own group.
2.4 Displaying More Information about Nodes
The Node pane of the Application window allows you to focus on resource
usage activity at a high level and to display more specific data
whenever you want. This section explains the basic use of the Node
pane. For more detailed information, see Chapter 3.
Within the group of nodes you select, the Availability Manager displays all the nodes with which that group can communicate. Figure 2-3 shows a list of OpenVMS nodes.
Figure 2-3 OpenVMS Node Pane
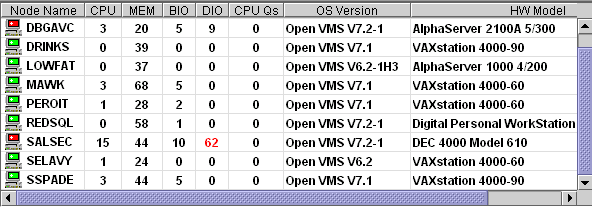
Each node name has an icon next to it. The color of the icon represents a state similar to those described in Table 2-1:
| Color | Description |
|---|---|
| Brown | Attempts to configure the node have failed---for example, because it failed the security check. |
| Yellow | Node security check is in progress or has failed. |
| Black | Path to node has been lost. |
| Red | Security check was successful. However, a threshold has been exceeded, and an event has been posted. |
| Green | Security check was successful; data is being collected. |
To choose a node on a Windows or an OpenVMS system, double-click a node name in the Node pane to highlight the name of the node and display the Node Summary page (Figure 2-4). Alternatively, you can right-click a node name to display a popup menu. To display the Node Summary page, select the Display... option.
Figure 2-4 OpenVMS Node Summary Page
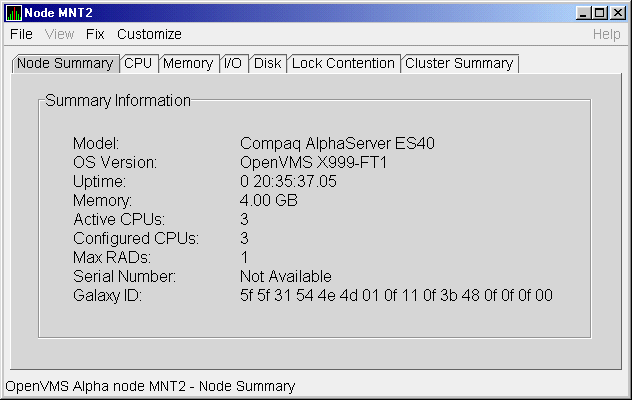
The data displayed on this page is explained in Chapter 3.
At the top of the Node Summary page are tabs that correspond to most of the types of node data displayed in the Node pane. When you click a tab on the Node Summary page, the Availability Manager displays most of the same pages that are displayed when you double-click a data item in the Node pane (see Figure 2-3).
2.4.2 Specifying Data to Collect on OpenVMS Nodes
For OpenVMS nodes, if you want background data collection (and the
associated event detection), you must turn on data
collection for each type of data you want to collect. On Windows nodes,
background data collection is always enabled and cannot be turned off.
To turn on various types of data to be collected, follow these steps:
The Availability Manager displays the Data Collection Customization page (Figure 2-5).
Background and foreground collections are explained in Chapter 1.
Figure 2-5 Data Collection Customization Page
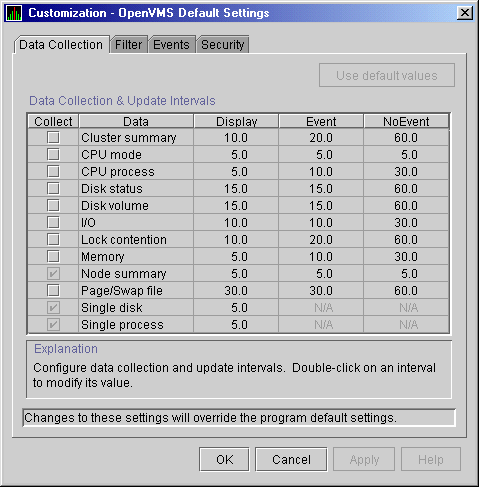
The following types of data are collected by default:
To stop collecting Node Summary data, for example, clear the check box for "Node summary" in the "Collect" column. You cannot, however, turn off the collection of single disk and single process data. These types of data are collected by default when you open a Single Disk Summary page or a Process Information page, respectively.
To turn on a type of data to be collected, select the check box for that type in the "Collect" column. Table 7-1 identifies the page where each type of data that is collected appears.
On the Data Collection Customization page, you can also change the intervals at which data is collected. Collection intervals are explained in Chapter 7.
2.4.3 Sorting Data
You can sort data in many OpenVMS displays, for example:
Depending on the field, you can sort data alphabetically or numerically. An alphabetical sort is performed using ASCII character values; for example, dollar signs ($) precede letters in the sort order.
To sort the values in a field, double-click the corresponding column heading. To reverse the sort order, double-click the column heading again.
| Previous | Next | Contents | Index |