HP OpenVMS Systems Documentation |
Compaq Availability Manager User's Guide
4.3.4.2 LAN Adapter Transmit Data PageThe LAN Adapter Transmit Data page, shown in Figure 4-22, displays LAN adapter transmit data. Figure 4-22 LAN Adapter Transmit Data Page Table 4-22 describes the data displayed in Figure 4-22.
4.3.4.3 LAN Adapter Receive Data PageThe LAN Adapter Receive Data page, shown in Figure 4-23, displays LAN adapter receive data. Figure 4-23 LAN Adapter Receive Data Page 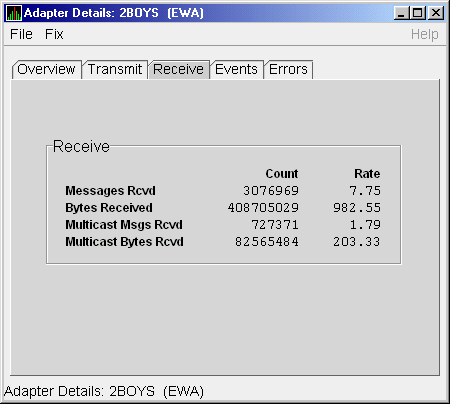
Table 4-23 describes the data displayed in Figure 4-23.
4.3.4.4 LAN Adapter Events Data PageThe LAN Adapter Events Data page, shown in Figure 4-24, displays LAN adapter events data. Figure 4-24 LAN Adapter Events Data Page 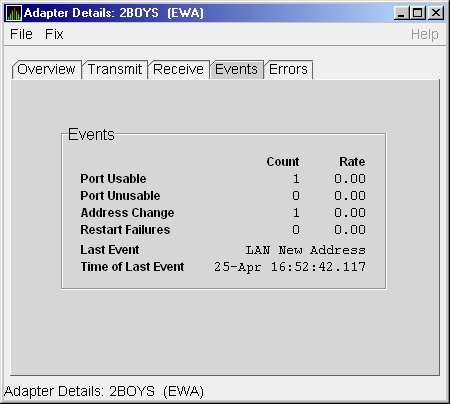
Table 4-24 describes the data displayed in Figure 4-24.
4.3.4.5 LAN Adapter Errors Data PageThe LAN Adapter Errors Data page, shown in Figure 4-25, displays LAN adapter errors data. Figure 4-25 LAN Adapter Errors Data Page 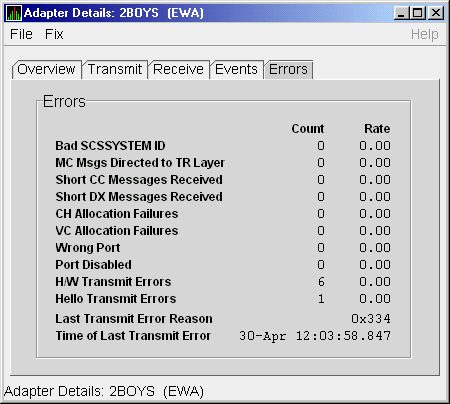
Table 4-25 describes the data displayed in Figure 4-25.
Chapter 5
|
Before you start this chapter, be sure to read the explanations of data collection, events, thresholds, and occurrences in Chapter 1. |
The Availability Manager indicates resource availability problems in the Event pane Figure 5-1 of the main Application window (see Figure 1-1).
Figure 5-1 OpenVMS Event Pane
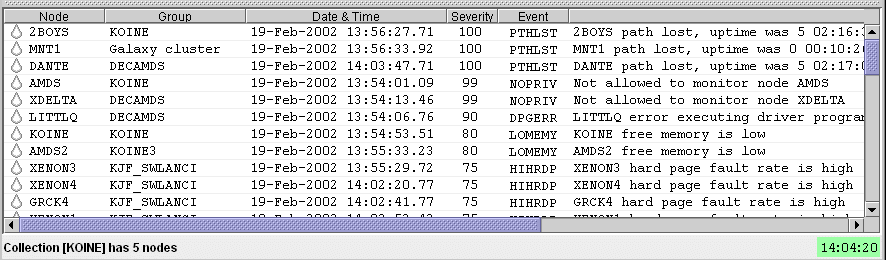
The Event pane helps you identify system problems. In many cases, you can apply fixes to correct these problems as well, as explained in Chapter 6.
The Availability Manager displays a warning message in the Event pane whenever it detects a resource availability problem. If logging is enabled (the default), the Availability Manager also logs each event in the Event Log file, which you can display or print. (See Section 5.2 for the location of this file and a cautionary note about it.)
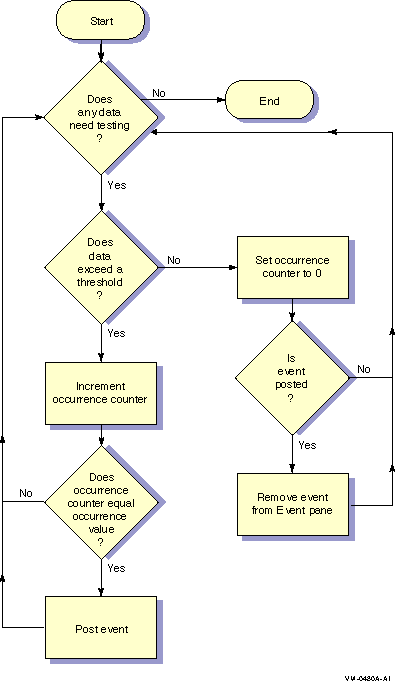
During data collection, any time data meets or exceeds the threshold for an event, an occurrence counter is incremented. When the incremented value matches the value in the Occurrence box on the Event Customization page (Figure 1-6), the event is posted in the Event pane of the Application window (see Figure 1-1).
Note that some events are triggered when data is lower than the threshold; other events are triggered when data is higher than the threshold.
If, at any time during data collection, the data does not meet or exceed the threshold, the occurrence counter is set to 0, and the event is removed from the Event pane. Figure 5-2 depicts this sequence.
Figure 5-2 Testing for Events
The Availability Manager can display events for all nodes that are currently in communication with the Data Analyzer. When an event of a certain severity occurs, the Availability Manager adds the event to a list in the Event pane.
The length of time an event is displayed depends on the severity of the
event. Less severe events are displayed for a short period of time (30
seconds); more severe events are displayed until you explicitly remove
the event from the Event pane (explained in Section 5.1.2).
5.1.1 Data in the Event Pane
Table 5-1 identifies the data items displayed in the Event pane.
| Data Item | Description |
|---|---|
| Node | Name of the node causing the event |
| Group | Group of the node causing the event |
| Date | Date the event occurred |
| Time | Time that an event was detected |
| Sev | Severity: a value from 0 to 100 |
| Event | Alphanumeric identifier of the type of event |
| Description | Short description of the resource availability problem |
Appendix B contains tables of events that are displayed in the Event pane. In addition, these tables contain an explanation of each event and the recommended remedial action.
5.1.2 Event Pane Menu Options
When you right-click a node name or data item in the Event pane, the
Availability Manager displays a popup menu with the following options:
| Menu Option | Description |
|---|---|
| Display | Displays the Node Summary page associated with that event. |
| Remove | Removes an event from the display. |
| Freeze/Unfreeze | Freezes a value in the display until you "unfreeze" it; a snowflake icon is displayed to the left of an event that is frozen. |
| Customize | Allows you to customize events. |
The Availability Manager uses the following criteria to determine whether to post an event and display it in the Event pane:
Figure 5-3 Sample Event Customization Page
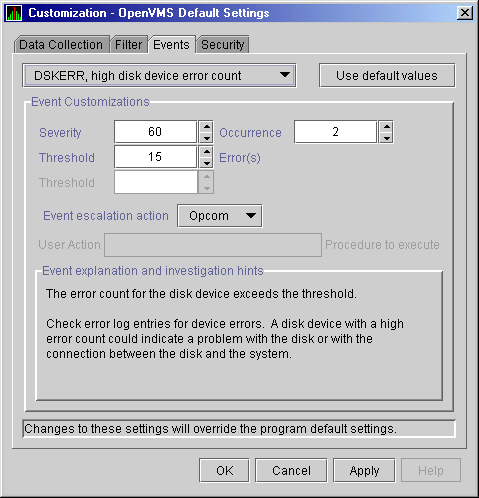
Figure 5-4 OpenVMS Data Collection Customization Page
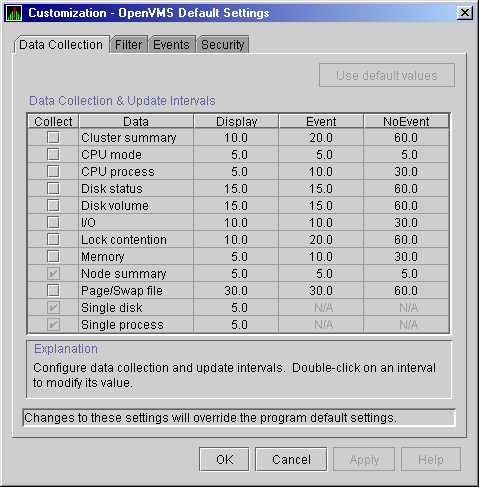
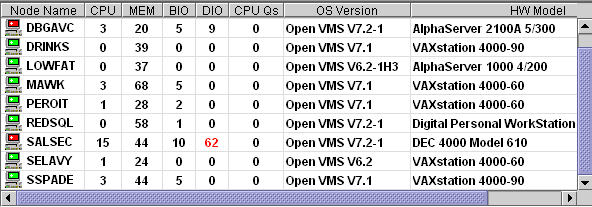
Figure 5-5 OpenVMS Node Pane
AMDS$AM_LOG:ANALYZEREVENTS.LOG
|
AnalyzerEvents.log
|
VAXJET 01-22-2001 11:24:50.67 0 CFGDON VAXJET configuration done DBGAVC 01-22-2001 11:25:12.41 0 CFGDON DBGAVC configuration done AFFS5 01-22-2001 11:25:13.23 0 CFGDON AFFS5 configuration done DBGAVC 01-22-2001 11:25:18.31 80 LCKCNT DBGAVC possible contention for resource REG$MASTER_LOCK VAXJET 01-22-2001 11:25:27.47 40 LOBIOQ VAXJET LES$ACP_V30 has used most of its BIOLM process quota PEROIT 01-22-2001 11:25:27.16 0 CFGDON PEROIT configuration done KOINE 01-22-2001 11:25:33.05 99 NOSWFL KOINE has no swap file MAWK 01-22-2001 11:26:20.15 99 FXTIMO MAWK Fix timeout for FID to Filename Fix MAWK 01-22-2001 11:26:24.48 60 HIDIOR MAWK direct I/O rate is high REDSQL 01-22-2001 11:26:30.61 10 PRPGFL REDSQL _FTA2: high page fault rate REDSQL 01-22-2001 11:26:31.18 60 PRPIOR REDSQL _FTA7: paging I/O rate is high MAWK 01-22-2001 11:26:24.48 60 HIDIOR MAWK direct I/O rate is high AFFS52 01-22-2001 11:25:33.64 60 DSKMNV AFFS52 $4$DUA320(OMTV4) disk mount verify in progress VAXJET 01-22-2001 11:38:46.23 90 DPGERR VAXJET error executing driver program, ... REDSQL 01-22-2001 11:39:18.73 60 PRCPWT REDSQL _FTA2: waiting in PWAIT REDSQL 01-22-2001 11:44:37.19 75 PRCCUR REDSQL _FTA7: has a high CPU rate |
If you collect data on many nodes, running the Availability Manager for a long period of time can result in a large event log. For example, in a run that monitors more than 50 nodes with most of the background data collection enabled, the event log can grow by up to 30 MB per day. At this rate, systems with small disks might fill up the disk on which the event log resides. Closing the Availability Manager application will enable you to access the event log for tasks such as archiving. Starting the Availability Manager starts a new event log. |
For more detailed information about a specific event, double-click any event data item in the Event pane. The Availability Manager first displays a data page that most closely corresponds to the cause of the event. You can choose other tabs for additional detailed information.
For a description of data pages and the information they contain, see Chapter 3.
You can perform fixes on OpenVMS nodes to resolve resource availability problems and improve system availability.
This chapter discusses the following topics:
Performing certain fixes can have serious repercussions, including possible system failure. Therefore, only experienced system managers should perform fixes. |
When you suspect or detect a resource availability problem, in many cases you can use the Availability Manager to analyze the problem and to perform a fix to improve the situation.
Availability Manager fixes fall into these categories:
You can access fixes, by category, from the pages listed in Table 6-1.
| Fix Category and Name | Available from This Page |
|---|---|
Node fixes:
Crash Node |
Node Summary
CPU Memory I/O |
Process fixes:
General process fixes:Delete Process |
All of the process fixes are available from the following pages:
Memory |
| Cluster interconnect fixes: | These fixes are available from the following lines of data on the Cluster Summary page (Figure 4-7): |
| -- Port Adjust Priority | Right-click a data item on the local port data display line to display a menu containing the Adjust Priority option. |
| -- Circuit Adjust Priority | Right-click a data item on the circuits data display line to display a menu containing the Adjust Priority option. |
LAN Virtual Circuit summary:
Maximum Transmit Window Size |
Right-click a data item in the LAN Virtual Circuit Summary category to display a menu. Then click the Fixes... menu item. |
LAN Path (Channel) Summary:
Adjust Priority |
Right-click a data item in the LAN Path (Channel) Summary category to display a menu. Then click the VC LAN Fix... menu item. |
LAN Adapter Details:
Adjust Priority |
Right-click a data item in the LAN Path (Channel) Summary category to display a menu. Then click the Adapter Details menu item to display pages containing Fix options. |
Table 6-2 summarizes various problems, recommended fixes, and the expected results of fixes.
| Problem | Fix | Result |
|---|---|---|
| Node resource hanging cluster | Crash Node | Node fails with operator-requested shutdown. |
| Cluster hung | Adjust Quorum | Quorum for cluster is adjusted. |
| Process looping, intruder | Delete Process | Process no longer exists. |
| Endless process loop in same PC range | Exit Image | Exits from current image. |
| Runaway process, unwelcome intruder | Suspend Process | Process is suspended from execution. |
| Process previously suspended | Resume Process | Process starts from point it was suspended. |
| Runaway process or process that is overconsuming | Process Priority | Base priority changes to selected setting. |
| Low node memory | Purge Working Set (WS) | Frees memory on node; page faulting might occur for process affected. |
| Working set too high or low | Adjust Working Set (WS) | Removes unused pages from working set; page faulting might occur. |
| Process quota has reached its limit and has entered RWAIT state | Adjust Process Limits | Process limit is increased, which in many cases frees the process to continue execution. |
| Process has exhausted its pagefile quota | Adjust Pagefile Quota | Pagefile quota limit of the process is adjusted. |
Most process fixes correspond to an OpenVMS system service call, as shown in the following table:
| Process Fix | System Service Call |
|---|---|
| Delete Process | $DELPRC |
| Exit Image | $FORCEX |
| Suspend Process | $SUSPND |
| Resume Process | $RESUME |
| Process Priority | $SETPRI |
| Purge Working Set (WS) | $PURGWS |
| Adjust Working Set (WS) | $ADJWSL |
Adjust process limits of the following:
Direct I/O (DIO) |
None |
Each fix that uses a system service call requires that the process execute the system service. A hung process will have the fix queued to it, where the fix will remain until the process is operational again. |
Be aware of the following facts before you perform a fix:
Standard OpenVMS privileges restrict users' write access. When you run the Data Analyzer, you must have the CMKRNL privilege to send a write (fix) instruction to a node with a problem.
The following options are displayed at the bottom of all fix pages:
| Option | Description |
|---|---|
| OK | Applies the fix and then exits the page. Any message associated with the fix is displayed in the Event pane. |
| Cancel | Cancels the fix. |
| Apply | Applies the fix and does not exit the page. Any message associated with the fix is displayed in the Return Status section of the page and in the Event pane. |
The following sections explain how to perform node fixes and process fixes.
| Previous | Next | Contents | Index |