 |
Compaq Availability Manager User's Guide
3.2.5.5 Windows Physical Disk Summary
A physical disk is hardware used on your computer
system. The Windows Physical Disk Summary displays disk volume data,
including path, label, queue statistics, transfers, and bytes per
second.
To display the Windows Physical Disk Summary, follow these steps:
- Click the View menu on the Windows Logical Disk Summary.
- Click the Physical Disk Summary menu option.
The Availability Manager displays the Windows Physical Disk Summary
page (Figure 3-17).
Figure 3-17 Windows Physical Disk Summary Page

This page displays the following data:
| Data |
Description |
|
Disk
|
Drive number, for example, 0, 1, 2 or
Total, which is the summation of statistics for all the disks.
|
|
Path
|
Primary path (node) from which the device receives commands.
|
|
Current Queue
|
Number of requests outstanding on the disk at the time the performance
data is collected; it includes requests in service at the time of data
collection.
|
|
Average Queue
|
Average number of read and write requests that were queued for the
selected disk during the sample interval.
|
|
Transfers/Sec
|
Rate of read and write operations on the disk. The rate is displayed in
kilobytes per second.
|
|
KBytes/Sec
|
Rate bytes are transferred to or from the disk during read or write
operations. The rate is displayed in kilobytes per second.
|
|
% Busy
|
Percentage of elapsed time the selected disk drive is busy servicing
read and write requests.
|
|
% Read Busy
|
Percentage of elapsed time the selected disk drive is busy servicing
read requests.
|
|
% Write Busy
|
Percentage of elapsed time the selected disk drive is busy servicing
write requests.
|
3.2.6 OpenVMS Lock Contention
To display the OpenVMS Lock Contention page, select the Lock Contention
tab on the OpenVMS Node Summary page. The Lock Contention page
(Figure 3-18) displays each resource in the group you have selected
for which a potential lock contention problem exists.
Figure 3-18 OpenVMS Lock Contention Page

This page displays the following data:
| Data |
Description |
|
Resource Name
|
Resource name associated with the $ENQ system service call. An ellipsis
(...) indicates an unprintable character.
|
|
Master Node
|
Node on which the resource is mastered.
|
|
Parent Resource
|
Name of the parent resource. If no name is displayed, the resource
listed is the parent resource.
|
|
Duration
|
Amount of time elapsed since the Availability Manager first detected the
contention situation.
|
|
Status
|
Status of the lock. See the $ENQ(W) description in the OpenVMS System Services Reference Manual.
|
When you double-click a data item under these headings, the
Availability Manager displays the following data:
| Data |
Description |
|
Node
|
Node name on which the lock is granted.
|
|
Process Name
|
Name of the process owning the blocking lock.
|
|
LKID
|
Lock ID value (which is useful with SDA).
|
|
Mode
|
One of the following modes at which the lock is granted or requested:
EX, CW, CR, PW, PR, NL.
|
|
Duration
|
Length of time the lock has been in the current queue (since the
console application found the lock).
|
|
Flags
|
Flags specified with the $ENQ(W) request.
|
Data is displayed in one of three colors:
| Color |
Meaning |
|
Green
|
Granted
|
|
Yellow
|
Converting
|
|
Pink
|
Waiting
|
To interpret the information displayed on the OpenVMS Lock Contention
Summary, you should understand OpenVMS lock management services. For
more information, see the OpenVMS System Services Reference Manual.
Note
Lock contention data is accurate only if every node in an OpenVMS
Cluster environment is in the same group. Multiple clusters can share a
group, but clusters cannot be divided into different groups without
losing accuracy.
|
The Availability Manager detects the following CPU-related events and displays
them in the Event pane:
PRCCOM, node process waiting in COM or COMO
PRCCVR, node process has high CPU rate
PRCMWT, node process waiting in MWAIT
PRCPWT, node process waiting in COLPG, PFW, or FPG
where:
- node is replaced by the name of the node to which the
event is related.
- process is replaced by the name of the process to which
the event is related.
3.3 OpenVMS Single Process
When you double-click a PID on the lower part of an OpenVMS CPU Process
(Figure 3-7), Memory (Figure 3-9), or I/O (Figure 3-11) page,
the Availability Manager displays the first of several OpenVMS Single Process
pages. On these pages, you can click tabs to display specific data
about one process. The following sections describe these pages.
Note About ENQ Values on Single Process Pages
In versions of Availability Manager prior to Version 2.0, whenever an
ENQ value in the Single Process page was above 32,767, the Availability
Manager assigned it a large default value (4,294,967,295, for example)
and displayed that large value. This problem has been corrected so that
any value up to 32 bits is displayed correctly.
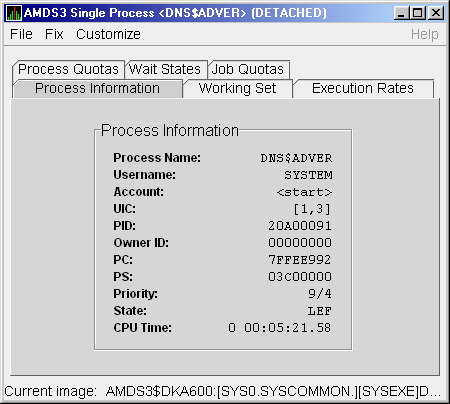
3.3.1 Single Process Information
To display the Single Process Information page (Figure 3-19), click
the Process Information tab. The data on this page is displayed at the
default intervals shown for Single Process Data on the Data Collection
Customization page.
Figure 3-19 Single Process Information Page

Table 3-7 describes the data in Figure 3-19.
Table 3-7 Single Process Information
| Data |
Description |
|
Process name
|
Name of the process.
|
|
Username
|
User name of the user who owns the process.
|
|
Account
|
Account string that the system manager assigns to the user.
|
|
UIC
|
User identification code (UIC). A pair of numbers or character strings
that designate the group and user.
|
|
PID
|
Process identifier. A 32-bit value that uniquely identifies a process.
|
|
Owner ID
|
Process identifier of the process that created the process displayed on
the page. If the PID is 0, then the process is a parent process.
|
|
PC
|
Program counter.
On OpenVMS Alpha systems, this value is displayed as 0 because the
data is not readily available to the Data Collector node.
|
|
PS
|
Processor status longword (PSL). This value is displayed on VAX systems
only.
|
|
Priority
|
Computable and base priority of the process. Priority is an integer
between 0 and 31. Processes with higher priority are given more CPU
time.
|
|
State
|
One of the process states listed in Appendix A.
|
|
CPU Time
|
CPU time used by the process.
|
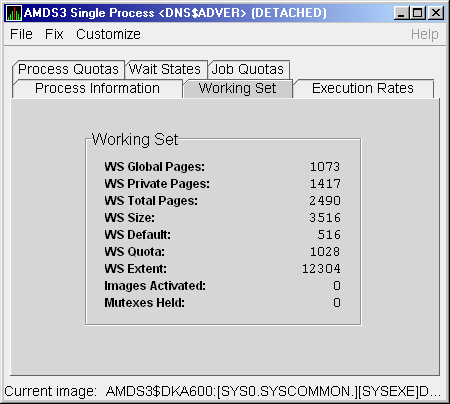
3.3.2 Single Process Working Set
To display the Single Process Working Set page (Figure 3-20), click
the Working Set tab.
Figure 3-20 Single Process Working Set Page

Table 3-8 describes the data in Figure 3-20.
Table 3-8 Single Process Working Set
| Data |
Description |
|
WS Global Pages
|
Shared data or code between processes, listed in pages (measured in
pagelets).
|
|
WS Private Pages
|
Amount of accessible memory, listed in pages (measured in pagelets).
|
|
WS Total Pages
|
Sum of global and private pages (measured in pagelets).
|
|
WS Size
|
Working set size. The number of pages (measured in pagelets) of memory
the process is allowed to use. This value is periodically adjusted by
the operating system based on analysis of page faults relative to CPU
time used. Increases in large units indicates that a process is taking
many page faults, and its memory allocation is increasing.
|
|
WS Default
|
Working set default. The initial limit of the number of physical pages
(measured in pagelets) of memory the process can use. This parameter is
listed in the user authorization file (UAF); discrepancies between the
UAF value and the displayed value are due to page/longword boundary
rounding or other adjustments made by the operating system.
|
|
WS Quota
|
Working set quota. The maximum amount of physical pages (measured in
pagelets) of memory the process can lock into its working set. This
parameter is listed in the UAF; discrepancies between the UAF value and
the displayed value are due to page/longword boundary rounding or other
adjustments made by the operating system.
|
|
WS Extent
|
Working set extent. The maximum number of physical pages (measured in
pagelets) of memory the system will allocate for the process. The
system provides memory to a process beyond its quota only when it has
an excess of free pages and can be recalled if necessary. This
parameter is listed in the UAF; any discrepancies between the UAF value
and the displayed value are due to page/longword boundary rounding or
other adjustments made by the operating system.
|
|
Images Activated
|
Number of times an image is activated.
|
|
Mutexes Held
|
Number of mutual exclusions (mutexes) held. Persistent values other
than zero (0) require analysis. A mutex is similar to a lock but is
restricted to one CPU. When a process holds a mutex, its priority is
temporarily increased to 16.
|
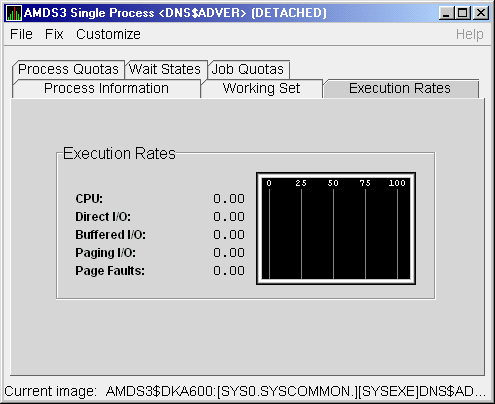
3.3.3 Single Process Execution Rates
To display the Single Process Execution Rates page (Figure 3-21),
click the Execution Rates tab.
Figure 3-21 Single Process Execution Rates Page

Table 3-9 describes the data in Figure 3-21.
Table 3-9 Single Process Execution Rates
| Data |
Description |
|
CPU
|
Percent of CPU time used by this process. The ratio of CPU time to
elapsed time.
|
|
Direct I/O
|
Rate at which I/O transfers take place from the pages or pagelets
containing the process buffer that the system locks in physical memory
to the system devices.
|
|
Buffered I/O
|
Rate at which I/O transfers take place for the process buffer from an
intermediate buffer from the system buffer pool.
|
|
Paging I/O
|
Rate of read attempts necessary to satisfy page faults. This is also
known as page read I/O or the hard fault rate.
|
|
Page Faults
|
Page faults per second for the process.
|
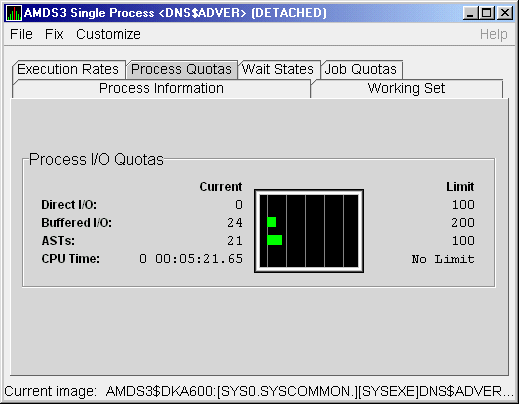
3.3.4 Single Process Quotas
To display the Single Process Quotas page (Figure 3-22), click the
Process Quotas tab.
Figure 3-22 Single Process Quotas Page

Table 3-10 describes the data displayed in Figure 3-22. When you
display the SWAPPER process, however, no values are listed in this
section. The SWAPPER process does not have quotas defined in the same
way as other system and user processes do.
Table 3-10 Single Process Quotas
| Data |
Description |
|
Direct I/O
|
The current number of direct I/Os used compared with the limit possible.
|
|
Buffered I/O
|
The current number of buffered I/Os used compared with the possible
limit.
|
|
ASTs
|
Asynchronous system traps. The current number of ASTs used compared
with the possible limit.
|
|
CPU Time
|
Amount of time used compared with the possible limit (in ms). "No
Limit" is displayed if the limit is 0.
|
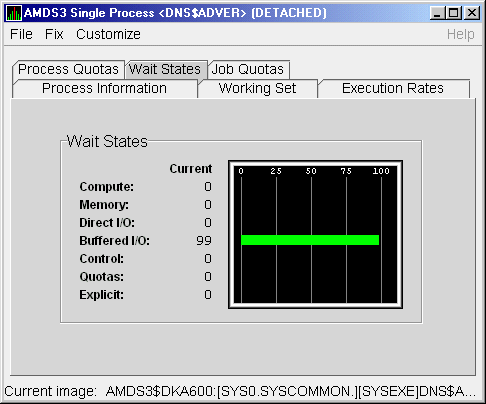
3.3.5 Single Process Wait States
To display the Single Process Wait States page (Figure 3-23), click
the Wait States tab.
Figure 3-23 Single Process Wait States Page

Table 3-11 describes the data in Figure 3-23. The wait state
specifies why a process cannot execute, based on calculations made on
collected data. Each value is calculated over a data collection period
of approximately 2 minutes.
"Current" refers to the percentage of elapsed time each
process spends in one of the computed wait states. If a process spends
all its time waiting in one state, the total approaches 100%.
Appendix A contains descriptions of process wait states.
Table 3-11 Single Process Wait States
| Data |
Description |
|
Compute
|
Relative value indicating that the process is waiting for CPU time.
Possible states are COM, COMO, or RWCAP.
|
|
Memory
|
Relative value indicating that the process is waiting for a page fault
that requires data to be read from disk; this is common during image
activation. Possible states are PFW, COLPG, FPG, RWPAG, RWNPG, RWMPE,
or RWMPB.
|
|
Direct I/O
|
Relative value indicating that the process is waiting for data to be
read from or written to a disk. The possible state is DIO.
|
|
Buffered I/O
|
Relative value indicating that the process is waiting for data to be
read from or written to a slower device such as a terminal, line
printer, or mailbox. The possible state is BIO.
|
|
Control
|
Relative value indicating that the process is waiting for another
process to release control of some resource. Possible states are CEF,
MWAIT, LEF, LEFO, RWAST, RWMBX, RWSCS, RWCLU, RWCSV, RWUNK, or LEF
waiting for an ENQ.
|
|
Quotas
|
Relative value indicating that the process is waiting because the
process has exceeded some quota. Possible states are QUOTA or
RWAST_QUOTA.
|
|
Explicit
|
Relative value indicating that the process is waiting because the
process asked to wait, such as a hibernate system service. Possible
states are HIB, HIBO, SUSP, SUSPO, or LEF waiting for a TQE.
|
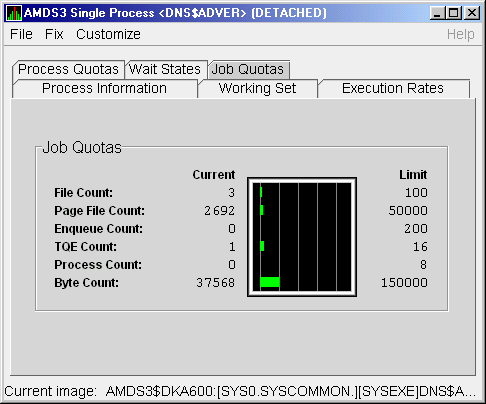
3.3.6 Single Process Job Quotas
To display the Single Process Job Quotas page (Figure 3-24), click
the Job Quotas tab.
Figure 3-24 Single Process Job Quotas Page

Table 3-12 describes the data in Figure 3-24.
Table 3-12 Single Process Job Quotas
| Data |
Description |
|
File Count
|
Current number of open files compared with the possible limit.
|
|
Page File Count
|
Current number of disk blocks in the page file that the process can use
compared with the possible limit.
|
|
Enqueue Count
|
Current number of resources (lock blocks) queued compared with the
possible limit.
|
|
TQE Count
|
Current number of timer queue entry (TQE) requests compared with the
possible limit.
|
|
Process Count
|
Current number of subprocesses created compared with the possible limit.
|
|
Byte Count
|
Current number of bytes used for buffered I/O transfers compared with
the possible limit.
|
|


