HP OpenVMS Systems Documentation |
OpenVMS Debugger Manual
1.12.6 Displaying Source CodeThe following commands control the display of source code:
1.12.7 Using Screen ModeThe following commands control screen mode and screen displays:
1.12.8 Editing Source CodeThe following commands control source editing from a debugging session:
1.12.9 Defining SymbolsThe following commands define and delete symbols for addresses, commands, or values:
1.12.10 Using Keypad ModeThe following commands control keypad mode and key definitions:
1.12.11 Using Command Procedures, Log Files, and Initialization FilesThe following commands are used with command procedures and log files:
1.12.12 Using Control StructuresThe following commands establish conditional and looping structures for debugger commands:
1.12.13 Debugging Multiprocess ProgramsThe following commands debug multiprocess programs. Note that these commands are specific to multiprocess programs. Many of the commands listed under other categories have qualifiers or parameters that are specific to multiprocess programs (for example, SET BREAK/ACTIVATING, EXIT process-spec, DISPLAY/PROCESS=).
1.12.14 Additional CommandsThe following commands are used for miscellaneous purposes:
Part 2
This part describes the debugger's command interface.
|
DBG> SET WATCH COUNT |
Detailed reference information about debugger commands is available in Part 6 and through the debugger's online help:
Online help is also available on the following topics:
New_Features
Release_Notes
Address_Expressions
Built_in_Symbols
DECwindows_Interface
Keypad_Definitions
Language_Support
Logical_Names
Messages (diagnostic messages)
Path_Names (to qualify symbolic names)
Screen_Mode
SS$_DEBUG condition (to start debugger from program)
System_Management
VWS_Workstations
To display help about any of these topics, type HELP topic. For example, to display information about diagnostic messages, type HELP Messages.
When you start the debugger, a few commonly used command sequences are automatically assigned to the keys on the numeric keypad (to the right of the main keyboard). Thus, you can perform certain functions either by entering a command or by pressing a keypad key.
The predefined key functions are identified in Figure 2-1.
Figure 2-1 Keypad Key Functions Predefined by the Debugger---Command Interface
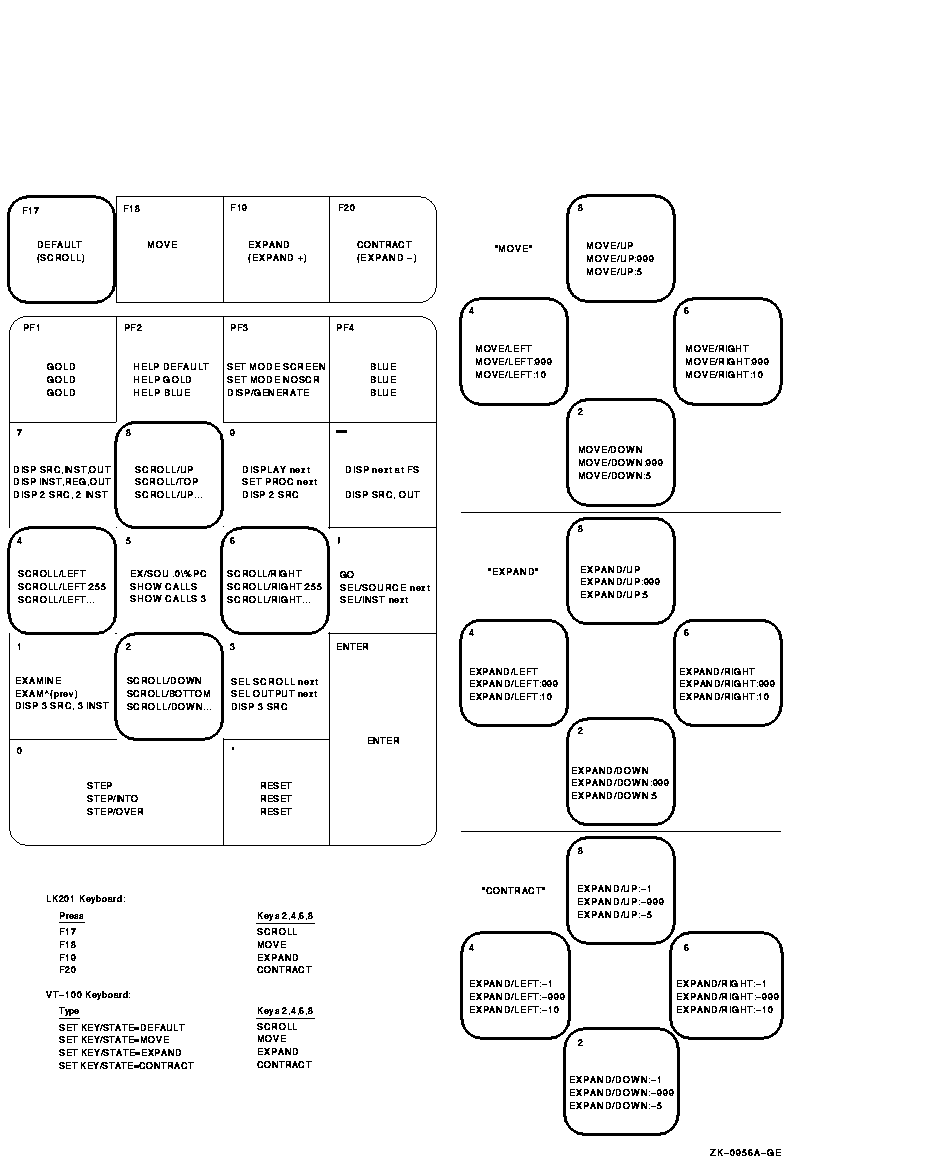
Most keypad keys have three predefined functions---DEFAULT, GOLD, and BLUE.
In Figure 2-1, the DEFAULT, GOLD, and BLUE functions are listed within each key's outline, from top to bottom, respectively. For example:
Normally, keys KP2, KP4, KP6, and KP8 scroll screen displays down, left, right, or up, respectively. By putting the keypad in the MOVE, EXPAND, or CONTRACT state, indicated in Figure 2-1, you can also use these keys to move, expand, or contract displays in four directions. Enter the command HELP Keypad_Definitions to display the keypad key definitions.
You can redefine keypad key functions with the DEFINE/KEY command.
2.2 Displaying Source Code
The debugger provides two modes for displaying information: noscreen
mode and screen mode. By default, when you start the debugger, you are
in noscreen mode, but you might find that it is easier to view source
code in screen mode. The following sections briefly describe both modes.
2.2.1 Noscreen Mode
Noscreen mode is the default, line-oriented mode of displaying input and output. The interactive examples throughout this chapter, excluding Section 2.2.2, show noscreen mode.
In noscreen mode, use the TYPE command to display one or more source lines. For example, the following command displays line 7 of the module in which execution is currently paused:
DBG> TYPE 7
module SWAP_ROUTINES
     7:        TEMP := A;
DBG>
|
The display of source lines is independent of program execution. To display source code from a module (compilation unit) other than the one in which execution is currently paused, use the TYPE command with a path name to specify the module. For example, the following command displays lines 16 to 21 of module TEST:
DBG> TYPE TEST\16:21 |
Path names are discussed in more detail in Section 2.3.2, with the STEP command.
You can also use the EXAMINE/SOURCE command to display the source line for a routine or any other program location that is associated with an instruction.
The debugger also displays source lines automatically when it suspends execution at a breakpoint or watchpoint, after a STEP command, or when a tracepoint is triggered (see Section 2.3).
After displaying source lines at various locations in your program, you can redisplay the location at which execution is currently paused by pressing KP5.
If the debugger cannot locate source lines for display, it issues a diagnostic message. Source lines might not be available for a variety of reasons. For example:
To switch to noscreen mode from screen mode, press PF1 PF3 (or type SET
MODE NOSCREEN). You can use the TYPE and EXAMINE/SOURCE commands in
screen mode as well as noscreen mode.
2.2.2 Screen Mode
Screen mode provides the easiest way to view your source code. To switch to screen mode, press PF3 (or type SET MODE SCREEN). In screen mode, by default the debugger splits the screen into three displays named SRC, OUT, and PROMPT, as shown in Figure 2-2.
Figure 2-2 Default Screen Mode Display Configuration
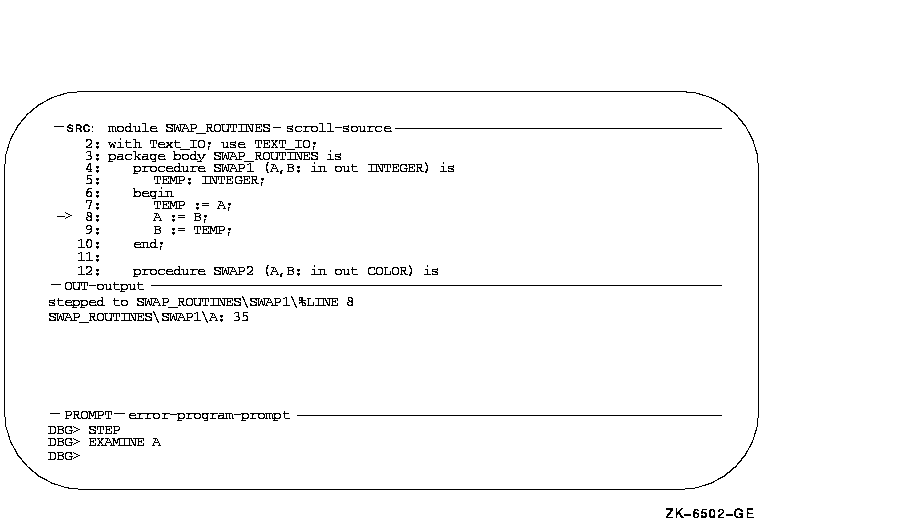
The SRC display shows the source code of the module in which execution is currently paused. An arrow in the left column points to the source line corresponding to the current value of the program counter (PC). The PC is a register that contains the memory address of the instruction to be executed next. The line numbers, which are assigned by the compiler, match those in a listing file. As you execute the program, the arrow moves down and the source code is scrolled vertically to center the arrow in the display.
The OUT display captures the debugger's output in response to the commands that you enter. The PROMPT display shows the debugger prompt, your input (the commands that you enter), debugger diagnostic messages, and program output.
You can scroll both SRC and OUT to see whatever information might scroll beyond the display window's edge. Press KP3 repeatedly as needed to select the display to be scrolled (by default, SRC is scrolled). Press KP8 to scroll up and KP2 to scroll down. Scrolling a display does not affect program execution.
In screen mode, if the debugger cannot locate source lines for the routine in which execution is currently paused, it tries to display source lines in the next routine down on the call stack for which source lines are available. If the debugger can display source lines for such a routine, it issues the following message:
%DEBUG-I-SOURCESCOPE, Source lines not available for .0\%PC. Displaying source in a caller of the current routine. DBG> |
In such cases, the arrow in the SRC display identifies the line that
contains code following the call statement in the calling routine.
2.3 Controlling and Monitoring Program Execution
This section explains how to perform the following tasks:
With this information you can pick program locations where you can then
test and manipulate the contents of variables as described in
Section 2.4.
2.3.1 Starting or Resuming Program Execution
Use the GO command to start or resume program execution.
After it is started with the GO command, program execution continues until one of the following events occurs:
With most programming languages, when you bring a program under debugger control, execution is initially paused directly at the beginning of the main program. Entering a GO command at this point quickly enables you to test for an infinite loop or an exception.
If an infinite loop occurs during execution, the program does not terminate, so the debugger prompt does not reappear. To obtain the prompt, interrupt execution by pressing Ctrl/C (see Section 1.4). If you are using screen mode, the pointer in the source display indicates where execution stopped. You can also use the SHOW CALLS command to identify the currently active routine calls on the call stack (see Section 2.3.3).
If an exception that is not handled by your program is signaled, the debugger interrupts execution at that point so that you can enter commands. You can then look at the source display and a SHOW CALLS display to find where execution is paused.
The most common use of the GO command is in conjunction with breakpoints, tracepoints, and watchpoints, as described in Section 2.3.4, Section 2.3.5, and Section 2.3.6, respectively. If you set a breakpoint in the path of execution and then enter the GO command, execution is paused at that breakpoint. Similarly, if you set a tracepoint, execution is monitored through that tracepoint. If you set a watchpoint, execution is paused when the value of the watched variable changes.
| Previous | Next | Contents | Index |