To display the debugger's command interface in the same window as
the program's I/O (as in Section 9.7.3.2), enter the following commands:
$ DEASSIGN/JOB DBG$INPUT
$ DEASSIGN/JOB DBG$OUTPUT
|
The debugger window remains open until you close it explicitly.
9.7.3.4 Explanation of DBG$DECW$DISPLAY and DECW$DISPLAY
By default, if your workstation is running Compaq DECwindows Motif for OpenVMS, the debugger
starts up in the Compaq DECwindows Motif for OpenVMS user interface, which is displayed on
the workstation specified by the Compaq DECwindows Motif for OpenVMS applicationwide logical
name DECW$DISPLAY. DECW$DISPLAY is defined in the job table by FileView
or DECterm and points to the display device for the workstation.
For information about DECW$DISPLAY, see the description of the DCL
commands SET DISPLAY and SHOW DISPLAY in the OpenVMS DCL Dictionary.
The logical name DBG$DECW$DISPLAY is the debugger-specific equivalent
of DECW$DISPLAY. DBG$DECW$DISPLAY is similar to the debugger-specific
logical names DBG$INPUT and DBG$OUTPUT. These logical names enable you
to reassign SYS$INPUT and SYS$OUTPUT, respectively, to specify the
device on which debugger input and output are to appear.
The default user interface of the debugger results when
DBG$DECW$DISPLAY is undefined or has the same translation as
DECW$DISPLAY. By default, DBG$DECW$DISPLAY is undefined.
The algorithm that the debugger follows when using the logical
definitions of DECW$DISPLAY and DBG$DECW$DISPLAY is as follows:
- If the logical name DBG$DECW$DISPLAY is defined, then use it.
Otherwise, use the logical name DECW$DISPLAY.
- Translate the logical name. If its value is not null (if the string
contains characters other than spaces), the Compaq DECwindows Motif for OpenVMS user
interface is displayed on the specified workstation. If the value is
null (if the string consists only of spaces), the command interface is
displayed in the DECterm window.
To enable the OpenVMS Debugger to start up in the Compaq DECwindows Motif for OpenVMS user
interface, first enter one of the following DCL commands:
$DEFINE DBG$DECW$DISPLAY "WSNAME::0"

$SET DISPLAY/CREATE/NODE=WSNAME
|
where WSNAME is the nodename of your workstation.
9.8 Starting the Motif Debug Client
The OpenVMS Debugger Version 7.2 features a client/server interface
that allows you to debug programs running on OpenVMS on a VAX or Alpha
CPU from a client interface running on the same or separate system.
The debugger client/server retains the functionality of the kept
debugger, but splits the debugger into two components: the debug server
and the debug client. The debug server runs on an OpenVMS system, and
is just like the kept debugger without the user interface. The debug
client contains the user interface, and runs on an OpenVMS system using
Compaq DECwindows Motif for OpenVMS, or on a PC running Microsoft Windows 95 or Microsoft
Windows NT.
9.8.1 Software Requirements
The debug server requires OpenVMS Version 7.2 or later.
The debug client can run on any of the following:
- OpenVMS Version 7.2 or later, along with Compaq DECwindows Motif for OpenVMS Version 1.2-4
- Microsoft Windows 95
- Microsoft Windows NT Version 3.51 or later (Intel or Alpha)
The OpenVMS Debugger client/server configuration also requires that the
following be installed on the OpenVMS node running the server:
Notes
If you are running TCP/IP Services for OpenVMS (UCX) Version 4.1, you
must have ECO2 installed. You can also run a later version of UCX.
The OpenVMS Version 7.2 installation procedures automatically install
DCE RPC.
|
9.8.2 Starting the Server
You can start the debug server after logging in directly to the OpenVMS
system, or you may find it more convenient to log in remotely with a
product such as eXcursion, or an emulator such as Telnet.
To start the debug server, enter the following command:
The server displays its network binding strings. The server port number
is enclosed in square brackets ([]). For example:
$ DEBUG/SERVER

%DEBUG-I-SPEAK: TCP/IP: YES, DECnet: YES, UDP: YES
%DEBUG-I-WATCH: Network Binding: ncacn_ip_tcp:16.32.16.138[1034]
%DEBUG-I-WATCH: Network Binding: ncacn_dnet_nsp:19.10[RPC224002690001]
%DEBUG-I-WATCH: Network Binding: ncadg_ip_udp:16.32.16.138[1045]
%DEBUG-I-AWAIT: Ready for client connection...
|
Use one of the network binding strings to identify this server when you
connect from the client (see Section 9.8.4). The following table
matches the network binding string prefix with its associated network
transport:
| Network Transport |
Network Binding String Prefix |
|
TCP/IP
|
ncacn_ip_tcp
|
|
DECnet
|
ncacn_dnet_nsp
|
|
UDP
|
ncadg_ip_udp
|
Notes
You can usually identify the server using only the node name and the
port number. For example,
nodnam[1034]
.
Messages and program output appear by default in the window in which
you start the server. You can redirect program output to another window
as required.
|
The following example contains an error message that indicates that DCE
is not installed:
$ debug/server
%LIB-E-ACTIMAGE, error activating image disk:[SYSn.SYSCOMMON.][SYSLIB]DTSS$SHR.EXE;
-RMS-E-FNF, file not found
|
This indicates that DCE is installed but not configured.
9.8.3 Primary Clients and Secondary Clients
The debugger client/server interface allows more than one client to be
connected to the same server. This allows team debugging, classroom
sessions, and other applications.
The primary client is the first client to connect to the server. A
secondary client is an additional client that has connected to the same
server. The primary client controls whether or not any secondary
clients can connect to the server.
Section 9.8.4 describes how to specify the number of secondary clients
allowed in a session.
9.8.4 Starting the Motif Client
A session is the connection between a particular client and a
particular server. Each session is identified within the client by the
network binding string the client used to connect to the server. Once
the debug server is running, start the Motif debug client. To do so,
enter the following command:
To establish a session from the Motif debug client, click on Server
Connection from the File menu. The Server Connection dialog displays,
in the Connection list, the default network binding string. This string
is based on the last string you entered, or the node on which the
client is running. There is not necessarily a server associated with
the default binding string. Figure 9-6 shows the Server Connection
dialog.
Figure 9-6 Debug Server Connection Dialog
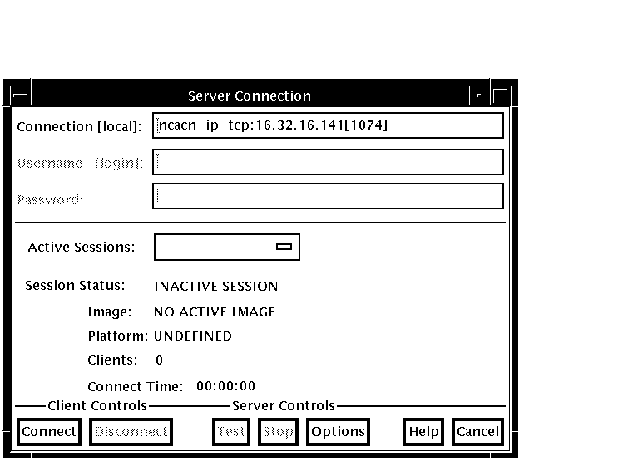
From the buttons at the bottom of the Server Connection dialog, you can
- Connect to the selected server to begin and activate a new session
- Disconnect from a session
- Test whether the session is still available
- Stop the server
- Cancel the connection operation and dismiss the dialog
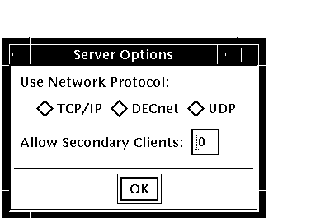
In addition, the Options button invokes the Server Options dialog,
which allows you to select the network transport to be used (see
Section 11.5.1).
The Server Options dialog also allows you to select the number of
secondary clients (0-31) allowed for a new session.
Figure 9-7 shows the Server Options dialog.
Figure 9-7 Server Options Dialog
To connect the client to a server, perform the following steps:
- Open the File menu.
- Click Server Connection.
- Enter the server network binding string in the Connection field, or
select the default string.
- Click Options.
- In the Server Options dialog, click on the network transport:
TCP/IP, DECnet, or UDP.
- In the Server Options dialog. select the number of secondary
clients (0-31) to be allowed.
- Click OK to dismiss the Server Options dialog.
- In the Server Connection dialog, click Connect.
You can establish connections to an unlimited number of servers by
repeating the sequence above and specifying the new network binding
string each time.
9.8.5 Switching Between Sessions
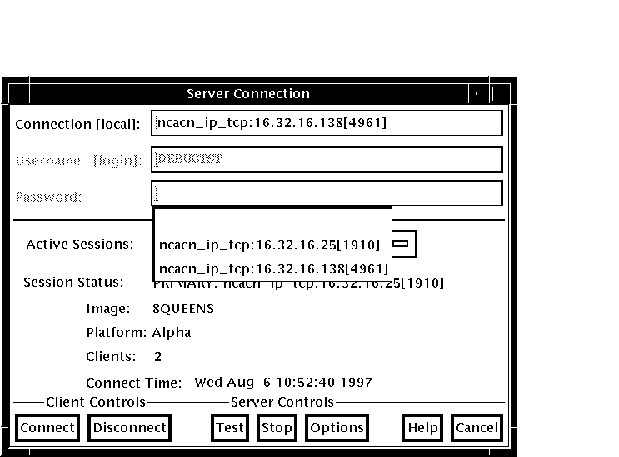
Each time you connect to a server and initiate a session, the session
is listed in the Active Sessions list in the Server Connection dialog
(see Figure 9-8). You can switch back and forth between sessions.
Each time you switch to a new session, the debugger updates the
contents of any open debugger displays with the new context.
To switch to a different session, perform the following steps:
- Open the File menu.
- Click Server Connection.
- Click the Active Sessions list to display the list of active
sessions.
- Double click the required session in the Active Sessions list.
This selects the session as the current session, dismisses the Server
Connection dialog, and updates the debugger displays with the current
context.
Note that you cannot change the number of secondary clients allowed on
a session while that session is active. To change the number of clients
allowed on a session, you must be the primary client, and perform the
following steps:
- Open the File menu.
- Specify the network binding string of the session.
- Click Disconnect.
- Click Options.
- In the Server Options dialog, click on the network transport:
TCP/IP, DECnet, or UDP.
- In the Server Options dialog, select the number of secondary
clients (0-31) to be allowed.
- Click OK to dismiss the Server Options dialog.
- In the Server Connection dialog, click Connect.
Figure 9-8 Active Sessions List
9.8.6 Closing a Client/Server Session
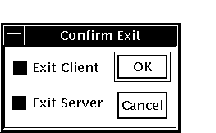
Click on Exit Debug? on the File menu to invoke the Confirm Exit
dialog. Figure 9-9 shows the Confirm Exit dialog.
Figure 9-9 Confirm Exit Dialog
Once you have invoked the Confirm Exit dialog, perform one of the
following:
- To terminate both the client and the server (default) click OK.
- To dismiss the Confirm Exit dialog without taking any action,
click Cancel.
- To terminate only the debug client, perform the following steps:
- Click Exit Server.
- Click OK.
- To terminate only the debug server, perform the following steps:
- Click Exit Client.
- Click OK.
If you do not terminate the debug server, you can connect to the server
from another debug client. If you do not terminate the client, you can
connect to another server for which you know the network binding string.
Chapter 10
Using the Debugger
This chapter explains how to:
The chapter describes window actions and window menu choices, but you
can perform most common debugger operations by choosing items from
context-sensitive pop-up menus. To access these menus, click MB3 while
the mouse pointer is in the window area.
You can also enter commands at the Compaq DECwindows Motif for OpenVMS command prompt. For
information about entering debugger commands, see Section 8.3.
For the source code of programs EIGHTQUEENS.EXE and 8QUEENS.EXE, shown
in the figures of this chapter, see Appendix D.
10.1 Displaying the Source Code of Your Program
The debugger displays the source code of your program in the main
window (see Figure 10-1).
Figure 10-1 Source Display
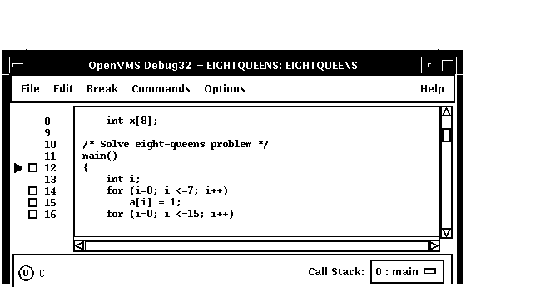
Whenever execution is suspended (for example, at a breakpoint), the
debugger updates the source display by displaying the code surrounding
the point at which execution is paused. The current-location pointer,
to the left of the source code, marks which line of code will execute
next. (A source line corresponds to one or more programming-language
statements, depending on the language and coding style.)
By default, the debugger displays compiler-generated line numbers to
the left of the source code. These numbers help identify breakpoints,
which are listed in the breakpoint view (see Section 10.4.4). You can
choose not to display line numbers so that more of the source code can
show in the window. To hide or display line numbers, toggle Display
Line Numbers from the File menu on the main window.
The Call Stack menu, between the source view and the push button view,
shows the name of the routine whose source code is displayed.
The current-location pointer is normally filled in as shown in
Figure 10-1. It is cleared if the displayed code is not that of the
routine in which execution is paused (see Section 10.1.3 and
Section 10.6.2).
You can use the scroll bars to show more of the source code. However,
you can scroll vertically through only one module of
your program at a time. (A module corresponds generally to a
compilation unit. With many programming languages, a module corresponds
to the contents of a source file. With some languages, such as Ada, a
source file might contain one or more modules.)
The following sections explain how to display source code for other
parts of your program so that you can set breakpoints in various
modules, and so on. Section 10.1.3 explains what to do if the debugger
cannot find source code for display. Section 10.6.2 explains how to
display the source code associated with routines that are currently
active on the call stack.
After navigating the main window, you can redisplay the location at
which execution is paused by clicking on the Call Stack menu.
If your program was optimized during compilation, the source code
displayed might not reflect the actual contents of some program
locations
(see Section 1.2).
10.1.1 Displaying the Source Code of Another Routine
To display source code of another routine:
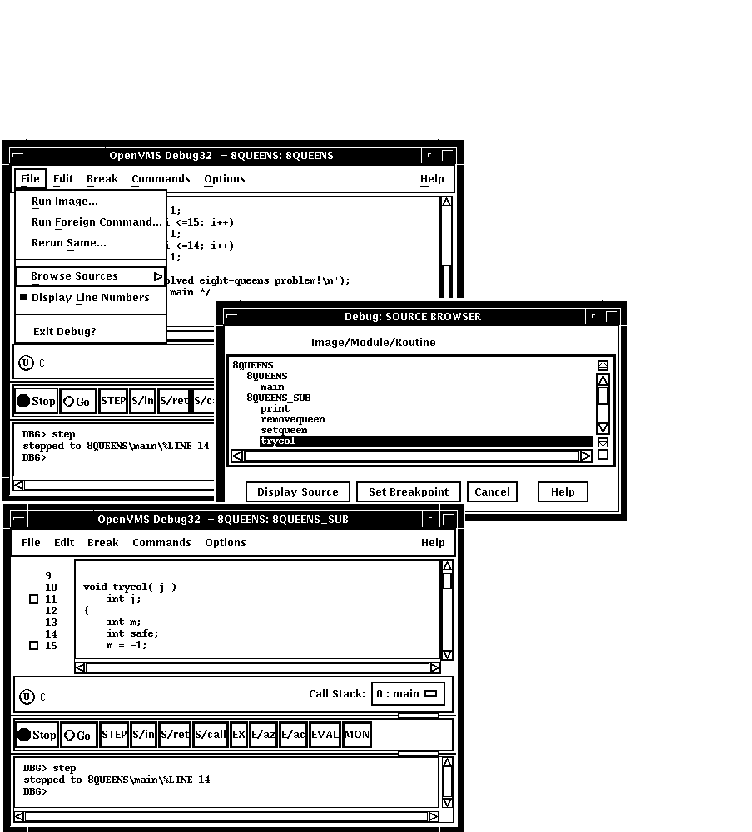
- Choose Browse Sources from the File menu on the main window (see
Figure 10-2).
Select SYMBOLIC display the names of all modules
linked in the image. Select ALL to display the names of only those
modules for which the debugger has symbolic information.
The Source
Browser dialog box displays the name of your executable image, which is
highlighted, and the class of shareable images linked with it (SYMBOLIC
or ALL). The name of a linked image is dimmed if no symbolic
information is available for that image.
- Double click on the name of your executable image. The names of
the modules in that image are displayed (indented) under the image name.
- Double click on the name of the module containing the routine of
interest. The names of the routines in that module are displayed
(indented) under the module name, and the Display Source button is now
highlighted.
- Click on the name of the routine whose source code you want to
display.
- Click on the Display Source push button. The debugger displays in
the source view the source code of the target routine, along with an
empty breakpoint button to the left of the source code. If the
instruction view is open, this display is updated to show the machine
code of the target routine.
Section 10.6.2 describes an alternative way to display routine source
code for routines currently active on the call stack.
Figure 10-2 Displaying Source Code of Another Routine
