| Previous | Contents | Index |
Symbol ambiguities can occur when a symbol (for example, a variable name X) is defined in more than one routine or other program unit.
In most cases, the debugger automatically resolves symbol ambiguities. First, it uses the scope and visibility rules of the currently set language. In addition, because the debugger permits you to specify symbols in arbitrary modules (to set breakpoints and so on), the debugger uses the ordering of routine calls on the call stack to resolve symbol ambiguities.
In some cases, however, the debugger might respond as follows when you specify a symbol that is defined multiple times:
To resolve such problems, you must specify a scope where the debugger should search for the particular declaration of the symbol:
DBG> EXAMINE SWAP\X |
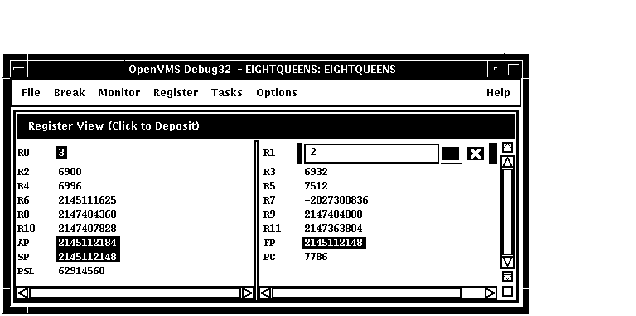
The register view displays the current contents of all machine registers (see Figure 10-20).
To display the register view, choose Views... from the Options menu on the main window or the optional views window, then click on Registers when the Views dialog box appears.
By default, the register view automatically displays the register values associated with the routine in which execution is currently paused. Any values that change as your program executes are highlighted whenever the debugger regains control from your program.
To display the register values associated with any routine on the call stack, choose its name from the Call Stack menu on the main window (see Section 10.6.2).
To change the value stored in a register:
To change the radix used to display register values:
Figure 10-20 Register View
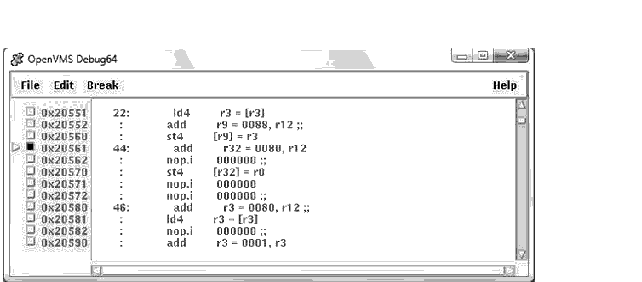
The instruction view displays the decoded instruction stream of your program: the code that is actually executing (see Figure 10-21). This is useful if the program you are debugging has been optimized by the compiler so that the information in the main window does not exactly reflect the code that is executing (see Section 1.2).
Figure 10-21 Instruction View
To display the instruction view, choose Views... from the Options menu on the main window or the optional views window, then click on Instructions when the Views dialog box appears.
By default, the instruction view automatically displays the decoded instruction stream of the routine in which execution is currently paused. The current-location pointer, to the left of the instructions, marks the instruction that will execute next.
By default, the debugger displays source code line numbers to the left of the instructions with which they are associated. To hide or display line numbers, toggle Display Line Numbers from the File menu in the instruction view.
By default, the debugger displays memory addresses to the left of the instructions. To hide or display addresses, toggle Show Instruction Addresses from the File menu in the instruction view.
After navigating the instruction view, click on the Call Stack menu to redisplay the location at which execution is paused.
To display the instruction stream of any routine on the call stack,
choose the routine's name from the Call Stack menu on the main window
(see Section 10.6.2).
10.9 Debugging Tasking (Multithread) Programs
Tasking programs, also called multithreaded programs, have multiple threads of execution within a process and include the following:
Within the debugger, the term task or thread denotes such a flow of control, regardless of the language or implementation. The debugger's tasking support applies to all such programs.
The debugger enables you to display task information and modify task characteristics to control task execution, priority, state transitions, and so on.
The following sections summarize the tasking features of the debugger's
HP DECwindows Motif for OpenVMS user interface. For more information about the debugger's
tasking support, see Chapter 16.
10.9.1 Displaying Information About Tasks (Threads)
To display information about one or more tasks (threads) of your program, choose Views... from the Options menu on the main window or the optional views window, then click on Threads when the Views dialog box appears.
The Threads view gives information about all currently existing (nonterminated) tasks of your program. The information is updated whenever the debugger regains control from the program, as shown in Figure 10-22.
Figure 10-22 Thread View
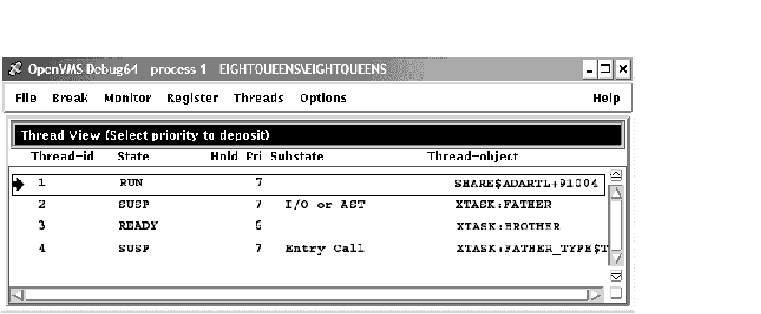
The displayed information includes:
10.9.2 Changing Task (Threads) Characteristics
To modify a task's (thread's) characteristics or the tasking
environment while debugging, choose one of the following items from the
Threads menu:
| Threads Menu Item | Description |
|---|---|
| Abort | Request that the selected task (thread) be terminated at the next allowed opportunity. The exact effect depends on the current event facility (language dependent). For Ada tasks, this is equivalent to executing an abort statement. |
| Activate | Make the selected task (thread) the active task. |
| Hold | Place the selected task (thread) on hold. |
| Nohold | Release the selected task (thread) from hold. |
| Make Visible | Make the selected task the visible task (thread). |
| All | Use the submenu to abort all tasks (threads) or release all tasks (threads) from hold. |
The debugger is installed on your system with a default debugger resource file (DECW$SYSTEM_DEFAULTS:VMSDEBUG.DAT) that defines the startup defaults for the following customizable parameters:
A copy of the system default debugger resource file with explanatory comments is included in Example 10-1 in Section 10.10.4.
You can modify the first three of these display attributes interactively from the HP DECwindows Motif for OpenVMS user interface, as explained in Section 10.10.1, Section 10.10.2, and Section 10.10.3. In each case, you can save the modified display configuration for future debugging sessions by choosing Save Options from the Options menu.
In addition, you can modify all the listed attributes of the debugger display configuration by editing and saving the debugger resource file, as explained in Section 10.10.4.
When you choose Save Options from the Options menu or you edit and save the local debugger resource file, the debugger creates a new version of the local debugger resource file DECW$USER_DEFAULTS:VMSDEBUG.DAT that contains the definitions of the display configuration attributes. When you next start the debugger, it uses the attributes defined in the most recent local resource file to configure the output display. You can fall back to previous debugger display configurations with appropriate use of the DCL commands DELETE, RENAME, and COPY.
To fall back to the system default display configuration, select
Restore Default Options from the OpenVMS Debugger Options menu.
10.10.1 Defining the Startup Configuration of Debugger Views
To define the startup configuration of the debugger views:
When you next start the debugger, the debugger uses the most recent resource file to create the new display configuration.
You can also define the startup display configuration by editing the
definition of these views in the resource file (see Section 10.10.4).
10.10.2 Displaying or Hiding Line Numbers in Source View and Instruction View
The source view and instruction view display source line numbers by default at debugger startup. To hide (or display) line numbers at debugger startup:
When you next start the debugger, the debugger uses the most recent resource file to create the new display configuration.
You can also set the startup default for line numbers by setting the following resources to either True or False in the resource file (see Section 10.10.4).
DebugSource.StartupShowSourceLineno: True DebugInstruction.StartupShowInstLineno: True |
10.10.3 Modifying, Adding, Removing, and Resequencing Push Buttons
The buttons on the push button view are associated with debugger
commands. You can:
You cannot modify or remove the Stop button. |
To save these modifications for future debugger sessions, choose Save Options from the Options menu.
Section 10.10.3.1, Section 10.10.3.2, and Section 10.10.3.3 explain how to customize push buttons interactively through the HP DECwindows Motif for OpenVMS user interface. You can also customize push buttons by editing the resource file. Button definitions in the resource file begin with:
DebugControl.Button |
(See Example 10-1.)
10.10.3.1 Changing a Button's Label or Associated Command
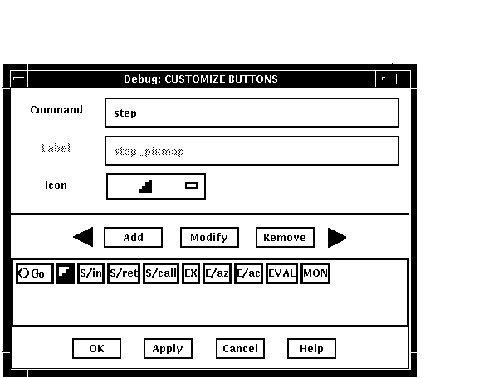
To change a button's label or associated command:
EVALUATE %s |
EXAMINE %%NEXTLOC |
To save these modifications for future debugger sessions, choose Save Options from the Options menu.
Figure 10-23 Changing the STEP Button Label to an Icon
To add a new button to the push button view and assign a debugger command to that button:
To save these modifications for future debugger sessions, choose Save Options from the Options menu.
Figure 10-24 Adding a Button
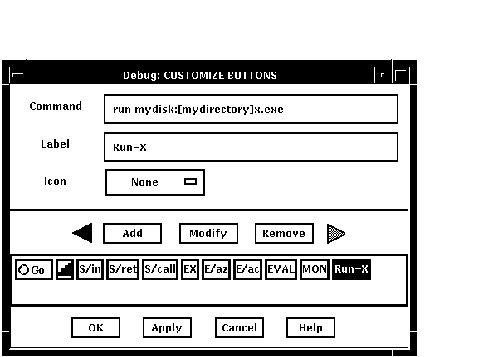
To remove a button:
To save these modifications for future debugger sessions, choose Save
Options from the Options menu.
10.10.3.4 Resequencing a Button
To resequence a button:
To save these modifications for future debugger sessions, choose Save
Options from the Options menu.
10.10.4 Editing the Debugger Resource File
The debugger is installed on your system with a default debugger resource file (DECW$SYSTEM_DEFAULTS:VMSDEBUG.DAT) that defines the default display configuration for the debugger. When you modify the display attributes as described in Section 10.10 and then save the modifications with the Save Options command in the Options menu, the debugger creates a local debugger resource file, DECW$USER_DEFAULTS:VMSDEBUG.DAT. You can edit this file to further modify the debugger display configuration.
If you do not have a local debugger resource file, you can create one with the Restore Default Options item in the Options menu. Whenever you start the debugger, it creates the debugger display configuration as defined in the most recent version of the local debugger resource file if there is one; otherwise, the debugger uses the definitions in the system debugger resource file, DECW$SYSTEM_DEFAULTS:VMSDEBUG.DAT.
You cannot edit the system resource file. You can modify the debugger display configuration either by following the procedures in Section 10.10.1, Section 10.10.2, and Section 10.10.3, or by editing and saving your local debugger resource file.
Example 10-1 contains a copy of the system default debugger resource file. Most entries are annotated within the file or are self-explanatory. Section 10.10.4.1, Section 10.10.4.2, Section 10.10.4.3, and Section 10.10.4.4 contain additional information about modifying certain key sequences. For complete information about specifying key sequences, see the translation table syntax in the X Toolkit Intrinsics documentation.
The line in Example 10-1 that begins with DebugControl.ButtonList does not completely fit in this example. This line identifies the button definitions contained in the file. The full line in the file also contains the following button names: StepReturnButton, StepCallButton, ExamineButton, ExamineASCIZButton, ExamineASCICButton, EvalButton, MonitorButton. |
| Example 10-1 System Default Debugger Resource File (DECW$SYSTEM_DEFAULTS:VMSDEBUG.DAT) |
|---|
!
! OpenVMS Debug32/64 Debugger Resource File
!
DebugVersion: 71
!
! GEOMETRY RESOURCES:
!
! Written when you execute "SAVE OPTIONS" from the Options Menu.
!
DebugSource.x:   11
DebugSource.y:   30
DebugSource.width:  620
DebugSource.height:  700
!
DebugControl.x:   650
DebugControl.y:   30
DebugControl.width:  600
DebugControl.height:  700
!
DebugEditor.x:   650
DebugEditor.y:   30
DebugEditor.width:  600
DebugEditor.height:  700
!
DebugInstruction.x:  11
DebugInstruction.y:  769
DebugInstruction.width:  620
DebugInstruction.height: 243
!
*DebugBrowser.x:  650
*DebugBrowser.y:  30
*DebugBrowser.width:  335
*DebugBrowser.height:  300
!
! LINE NUMBER DISPLAY RESOURCES:
!
!   Create the line or address number display in views at startup?
!
DebugSource.StartupShowSourceLineno: True
DebugInstruction.StartupShowInstLineno: True
DebugInstruction.StartupShowInstAddrno: False
!
! WINDOW PANE RESOURCES:
!
! Relative size of panes in main window.
! Main window height is derived from sum of panes.
!
DebugSource*SrcView.height:  460
DebugSource*PushbuttonPanel.height: 36
DebugSource*MessageOutputPanel.height: 145
!
DebugControl.BreakpointView.height: 175
DebugControl.MonitorView.height: 150
DebugControl.TaskView.height:  130
DebugControl.RegisterView.height: 250
!
! CUSTOM BUTTON RESOURCES:
!
! The following resources determine which buttons to put in the button panel.
! Buttons will show in the order they are listed here.
! For each button there MUST be a set of associated resources.
! EXAMPLE:
!   ButtonCommand    - Associates a command with the button.
!   ButtonLegend     - Button Label or pixmap name if pixmap flag is True.
!   ButtonPixmapFlag - If True uses ButtonLegend as predefined pixmap name.
!
DebugControl.ButtonList: \ GoButton, StepButton, StepInButton, ...

!
DebugControl.ButtonCommand.GoButton:  go
DebugControl.ButtonLegend.GoButton:  go_pixmap
DebugControl.ButtonPixmapFlag.GoButton:  True
!
DebugControl.ButtonCommand.StepButton:  step
DebugControl.ButtonLegend.StepButton:  STEP
DebugControl.ButtonPixmapFlag.StepButton: False
!
DebugControl.ButtonCommand.StepInButton: step/in
DebugControl.ButtonLegend.StepInButton:  S/in
DebugControl.ButtonPixmapFlag.StepInButton: False
!
DebugControl.ButtonCommand.StepReturnButton: step/return
DebugControl.ButtonLegend.StepReturnButton: S/ret
DebugControl.ButtonPixmapFlag.StepReturnButton: False
!
DebugControl.ButtonCommand.StepCallButton: step/call
DebugControl.ButtonLegend.StepCallButton: S/call
DebugControl.ButtonPixmapFlag.StepCallButton: False
!
DebugControl.ButtonCommand.ExamineButton: examine %s
DebugControl.ButtonLegend.ExamineButton: EX
DebugControl.ButtonPixmapFlag.ExamineButton: False
!
DebugControl.ButtonCommand.ExamineASCIZButton: examine/asciz %s
DebugControl.ButtonLegend.ExamineASCIZButton: E/az
DebugControl.ButtonPixmapFlag.ExamineASCIZButton: False
!
DebugControl.ButtonCommand.ExamineASCICButton: examine/ascic %s
DebugControl.ButtonLegend.ExamineASCICButton: E/ac
DebugControl.ButtonPixmapFlag.ExamineASCICButton: False
!
DebugControl.ButtonCommand.EvalButton:  evaluate %s
DebugControl.ButtonLegend.EvalButton:  EVAL
DebugControl.ButtonPixmapFlag.EvalButton: False
!
DebugControl.ButtonCommand.MonitorButton: monitor %s
DebugControl.ButtonLegend.MonitorButton: MON
DebugControl.ButtonPixmapFlag.MonitorButton: False
!
! THE FOLLOWING RESOURCES CAN ONLY BE CHANGED BY EDITING THIS FILE.
! -----------------------------------------------------------------
! Be sure to trim off any trailing white-spaces.
!
! FONT RESOURCES:
!
!   If a font is specified for a view, and the font is available on the
!   system, it will be used for that view.
!
!   For any views which do not explicitly specify a font, the font specified
!   by the resource "DebugDefault.Font" will be used if it is available on the
!   system.
!
!   If no font resources are specified at all, the debugger will use the
!   systems own default font specification.
!
!   The "DebugOptions.Font" applies to all optional views.  We suggest that
!   you select a font with a point size no larger than 14 in the option views
!   in order to preserve label alignment.
!
!   Using 132 column sources?  Try this narrow font:
!       -dec-terminal-medium-r-narrow--14-100-100-100-c-60-iso8859-1
!
!              FORMAT:   -*-FONTNAM-FACE-T-*--*-PTS-*-*-*-*-CHARSET
!
DebugDefault.Font:  -*-COURIER-BOLD-R-*--*-120-*-*-*-*-ISO8859-1
DebugSource.Font:   -*-COURIER-BOLD-R-*--*-120-*-*-*-*-ISO8859-1
DebugInstruction.Font:   -*-COURIER-BOLD-R-*--*-140-*-*-*-*-ISO8859-1
DebugMessage.Font:  -*-COURIER-BOLD-R-*--*-120-*-*-*-*-ISO8859-1
DebugOptions.Font:   -*-COURIER-BOLD-R-*--*-120-*-*-*-*-ISO8859-1
!
! STARTUP RESOURCES: 3=Iconified, 0=Visible
!
DebugSource.initialState:  0
DebugControl.initialState:  0
DebugEditor.initialState:  0
DebugInstruction.initialState:  0
!
! COLOR RESOURCES:
!
! Use any of the OSF Motif Named Colors.
!
! Foreground = Text Color, Background = Window Color
!
! Try: Gainsboro, MintCream, Linen, SeaShell, MistyRose, Honeydew
!      Cornsilk, Lavender
!
! To use your system default color scheme, comment out all lines
! pertaining to color.
!
! Common color scheme (unless overridden for a specific view)
!
*background:     Gainsboro
*borderColor:     Red
!
! Source View Colors
!
!DebugSource*background:   Gainsboro
DebugSource*topShadowColor:                     WindowTopshadow
DebugSource*bottomShadowColor:                  WindowBottomshadow
DebugSource*src_txt.foreground:   blue
DebugSource*src_txt.background:   white
DebugSource*src_lineno_txtw.foreground:  red
DebugSource*cnt_msg_txt.foreground:  black
DebugSource*cnt_msg_txt.background:  white
!
! Control View Colors
!
!DebugControl*background:   Gainsboro
DebugControl*topShadowColor:                    WindowTopshadow
DebugControl*bottomShadowColor:                 WindowBottomshadow
!
! Instruction View Colors
!
!DebugInstruction*background:   Gainsboro
DebugInstruction*topShadowColor:                WindowTopshadow
DebugInstruction*bottomShadowColor:             WindowBottomshadow
DebugInstruction*inst_txt.foreground:  blue
DebugInstruction*inst_txt.background:  white
DebugInstruction*inst_addrno_txtw.foreground:  red
!
! Editor Colors
!
!DebugEditor*background:   Gainsboro
DebugEditor*topShadowColor:                 WindowTopshadow
DebugEditor*bottomShadowColor:              WindowBottomshadow
DebugEditor*edit_textw.foreground:  black
DebugEditor*edit_textw.background:  white
!
! REGISTER VIEW RESOURCES:
!

! Which Registers to display by default in the Register View?
! CF = Call Frame, GP = General Purpose, FP = Floating Point (Integrity server and Alpha Only)

!
*Show_CF_Registers.set:  True
*Show_GP_Registers.set:  False
*Show_FP_Registers.set:  False
!
! SHOW MESSAGE/COMMAND SEPARATOR LINES?
!
*Show_Message_Separators.set:  True
!
! TRACK LANGUAGE CHANGES? (parser follows module language)
!
*Track_Language_Changes.set:  False
!
! KEY SEQUENCE RESOURCES:
!
! Key sequence used to activate the dialog box for conditional and action
! breakpoints.
!
DebugSource.ModifyBreakpointToggleSequence: Ctrl <Btn1Down>, Ctrl <Btn1Up>
!
! GENERAL KEYPAD FUNCTIONS:
!
!<Key>0xFFB0=KP0, <Key>0xFF91,<Key>0xFFB0=GOLD-KP0,
!<Key>0xFF94,<Key>0xFFB0=BLUE-KP0, <Key>0xFFB1=KP1,
!<Key>0xFF91,<Key>0xFFB1=GOLD-KP1, <Key>0xFFAC=KP,
DebugSource.*XmText.translations:#override\n\
    <Key>0xFFB0: EnterCmdOnCmdLine("step/line") \n\
    <Key>0xFFB1: EnterCmdOnCmdLine("examine") \n\
    <Key>0xFFAC: EnterCmdOnCmdLine("go") \n\
    <Key>0xFF91,<Key>0xFFB0: EnterCmdOnCmdLine("step/into") \n\
    <Key>0xFF94,<Key>0xFFB0: EnterCmdOnCmdLine("step/over") \n\
    <Key>0xFF91,<Key>0xFFB1: EnterCmdOnCmdLine("examine^") \n\
    <Key>0xFFB5: EnterCmdOnCmdLine("show calls") \n\
    <Key>0xFF91,<Key>0xFFB5: EnterCmdOnCmdLine("show calls 3") \n\
    <Key>0xFF8D: activate()\n
!
! IDENTIFIER WORD SELECTION: (language-based delimiters)
! NOTE: DO NOT use any double click combination for the following resource
!       otherwise normal text selection in the source window will not work.
!
DebugSource.IdentifierSelectionSequence: Ctrl<Btn1Down>
!
! EXIT CONFIRMATION:
!
DebugDisplayExitConfirmDB:  True
!
! COMMAND ECHO:
!
DebugEchoCommands:   True
!
! TITLE FORMAT: Main window and optional view window.
!
! The following title format directives are supported:
!
!   %t - The title of the debugger application.
!   %p - The name of the user program being debugged.
!   %f - The name of the current file displayed in the source window.
!
DebugControl.TitleFormat: %t - %p: %f
!
! DRAG AND DROP MESSAGE SUPRESSION: (Dont mess with these)
!
*.dragInitiatorProtocolStyle: DRAG_NONE
*.dragReceiverProtocolStyle:  DRAG_NONE
|
| Previous | Next | Contents | Index |