Compaq Availability Manager User's Guide
7.4.3 OpenVMS Disk Volume Filters
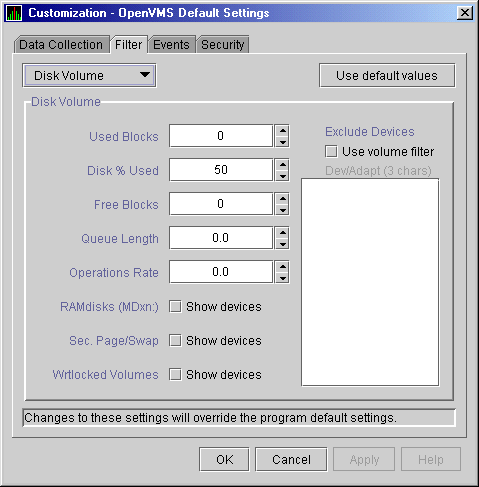
When you click Disk Volume on the Filter page, the
Availability Manager displays the OpenVMS Disk Volume Filters page
(Figure 7-7).
Figure 7-7 OpenVMS Disk Volume Filters Page

The OpenVMS Disk Volume Filters page allows you to change the values
for the following data:
| Data |
Description |
|
Used Blocks
|
The number of volume blocks in use.
|
|
Disk % Used
|
The percentage of the number of volume blocks in use in relation to the
total volume blocks available.
|
|
Free Blocks
|
The number of blocks of volume space available for new data.
|
|
Queue Length
|
Current length of all queues.
|
|
Operations Rate
|
The rate at which the operations count to the volume has changed since
the last sampling. The rate measures the amount of activity on a
volume. The optimal load is device-specific.
|
You can also change options for the following to be on (checked) or off
(unchecked):
- RAMdisks (MDxn:): Show devices
- Wrtlocked Volumes: Show devices
- Sec. Page/Swap: Show devices
- Filtered Volumes: Use filter
7.4.4 OpenVMS I/O Filters
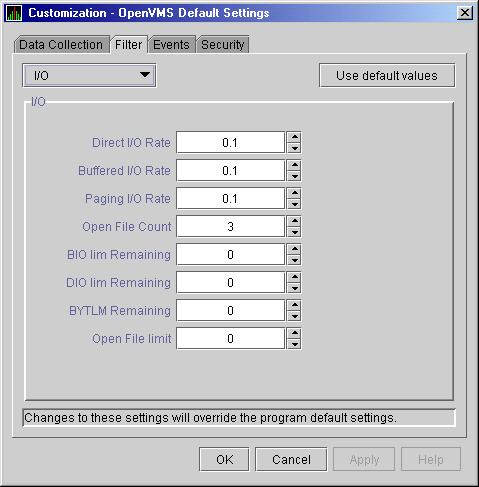
When you click I/O on the Filter page, the
Availability Manager displays the OpenVMS I/O Filters page (Figure 7-8).
Figure 7-8 OpenVMS I/O Filters Page

The OpenVMS I/O Summaries page (Figure 3-11) displays the values you
set on this filters page.
This filters page allows you to change values for the following data:
| Data |
Description |
|
Direct I/O Rate
|
The rate at which I/O transfers occur between the system devices and
the pages or pagelets that contain the process buffer that the system
locks in physical memory.
|
|
Buffered I/O Rate
|
The rate at which I/O transfers occur between the process buffer and an
intermediate buffer from the system buffer pool.
|
|
Paging I/O Rate
|
The rate of read attempts necessary to satisfy page faults (also known
as Page Read I/O or the Hard Fault Rate).
|
|
Open File Count
|
The number of open files.
|
|
BIO lim Remaining
|
The number of remaining buffered I/O operations available before the
process reaches its quota. BIOLM quota is the maximum number of
buffered I/O operations a process can have outstanding at one time.
|
|
DIO lim Remaining
|
The number of remaining direct I/O limit operations available before
the process reaches its quota. DIOLM quota is the maximum number of
direct I/O operations a process can have outstanding at one time.
|
|
BYTLM Remaining
|
The number of buffered I/O bytes available before the process reaches
its quota. BYTLM is the maximum number of bytes of nonpaged system
dynamic memory that a process can claim at one time.
|
|
Open File limit
|
The number of additional files the process can open before reaching its
quota. FILLM quota is the maximum number of files that can be opened
simultaneously by the process, including active network logical links.
|
7.4.5 OpenVMS Lock Contention Filters
The OpenVMS Lock Contention Filters page allows you to remove (filter
out) resource names from the Lock Contention page (Figure 3-18).
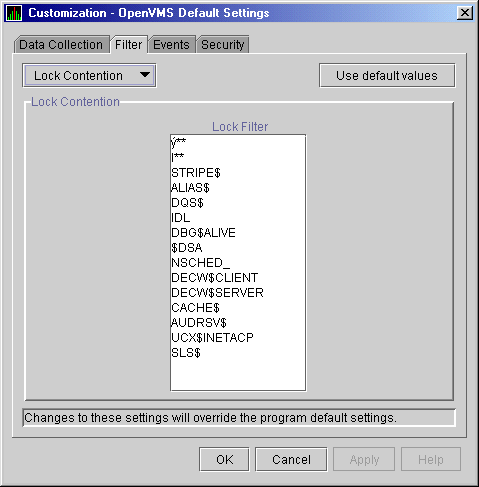
When you click Lock Contention on the Filter page, the
Availability Manager displays the OpenVMS Lock Contention Filters page
(Figure 7-9).
Figure 7-9 OpenVMS Lock Contention Filters Page

Each entry on the Lock Contention Filters page is a resource name or
part of a resource name that you want to filter out. For example, the
STRIPE$ entry filters out any value that starts with the characters
STRIPE$. To redisplay original entries, click Use default
values.
7.4.6 OpenVMS Memory Filters
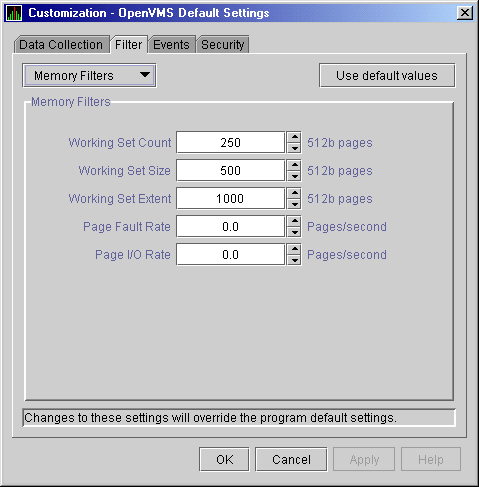
When you click Memory Filters on the Filter page, the
Availability Manager displays the OpenVMS Memory Filters page (Figure 7-10).
Figure 7-10 OpenVMS Memory Filters Page

The OpenVMS Memory page (Figure 3-9) displays the values on this
filters page.
The OpenVMS Memory Filters page allows you to change values for the
following data:
| Data |
Description |
|
Working Set Count
|
The number of physical pages or pagelets of memory that the process is
using.
|
|
Working Set Size
|
The number of pages or pagelets of memory the process is allowed to
use. The operating system periodically adjusts this value based on an
analysis of page faults relative to CPU time used. An increase in this
value in large units indicates a process is receiving a lot of page
faults and its memory allocation is increasing.
|
|
Working Set Extent
|
The number of pages or pagelets of memory in the process's WSEXTENT
quota as defined in the user authorization file (UAF). The number of
pages or pagelets will not exceed the value of the system parameter
WSMAX.
|
|
Page Fault Rate
|
The number of page faults per second for the process.
|
|
Page I/O Rate
|
The rate of read attempts necessary to satisfy page faults (also known
as page read I/O or the hard fault rate).
|
7.4.7 OpenVMS Page/Swap File Filters
When you click Page/Swap File on the Filter page, the
Availability Manager displays the OpenVMS Page/Swap File Filters page
(Figure 7-11).
Figure 7-11 OpenVMS Page/Swap File Filters Page

The OpenVMS I/O Summaries page (Figure 3-11) displays the values that
you set on this filters page.
This filters page allows you to change values for the following data:
| Data |
Description |
|
Used Blocks
|
The number of used blocks within the file.
|
|
Page File % Used
|
The percentage of the blocks from the page file that have been used.
|
|
Swap File % Used
|
The percentage of the blocks from the swap file that have been used.
|
|
Total Blocks
|
The total number of blocks in paging and swapping files.
|
|
Reservable Blocks
|
Number of reservable blocks in each paging and swapping file currently
installed. Reservable blocks can be logically claimed by a process for
a future physical allocation. A negative value indicates that the file
might be overcommitted. Note that a negative value is not an immediate
concern but indicates that the file might become overcommitted if
physical memory becomes scarce.
|
You can also select (turn on) or clear (turn off) the following options:
- Show page files
- Show swap files
7.5 Customizing Events and User Notification of Events
You can customize a number of characteristics of the events that are
displayed in the Event pane of the Application window (Figure 1-1).
You can also use customization options to notify users when specific
events occur.
When you select the Customize OpenVMS... or
Customize Windows NT... option from the Application
window's Customize menu, the Availability Manager
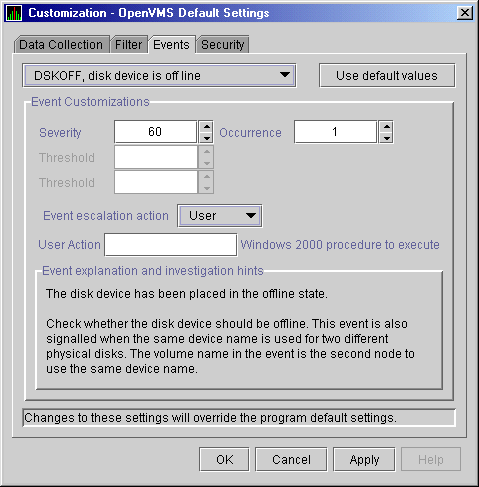
displays a tabbed page similar to the one shown in Figure 7-12.
Figure 7-12 Event Customization Page

7.5.1 Customizing Events
You can change the values for any data that is available (not dimmed)
on this page.
The following table describes the data you can change:
| Data |
Description |
|
Severity
|
Controls the severity level at which events are displayed in the Event
pane. By default, all events are displayed. Increasing this value
reduces the number of event messages in the Event pane and can improve
perceived response time.
|
|
Occurrence
|
Each Availability Manager event is assigned an
occurrence value,
that is, the number of consecutive data samples that must exceed the
event threshold before the event is signaled.
By default, events have low occurrence values. However, you might find
that a certain event indicates a problem only when it occurs repeatedly
over an extended period. You can change the occurrence value assigned
to that event so that the Availability Manager signals it only when necessary.
For example, suppose page fault spikes are common in your
environment, and the Availability Manager frequently signals intermittent
HITTLP, total page fault rate is high events. You could change
the event's occurrence value to 3, so that the total page fault rate
must exceed the threshold for three consecutive collection intervals
before being signaled to the event log.
To avoid displaying insignificant events, you can customize an event
so that the Availability Manager signals it only when it occurs continuously.
|
|
Threshold
|
Most events are checked against only one threshold; however, some
events have dual
thresholds, where the event is triggered if either one is true. For
example, for the
LOVLSP, node disk volume free space is low event, the
Availability Manager checks both of the following thresholds:
- Number of blocks remaining (
LowDiskFreeSpace.BlkRem)
- Percentage of total blocks remaining (
LowDiskFreeSpace.Percent)
|
|
Event escalation action
|
You can enter one of the following values:
- None: Take no action if this event occurs.
- Opcom:
Not yet implemented.
- User: If the event occurs, the Availability Manager refers to the
"User Action" field to determine what action to take.
|
|
User Action
|
When the "Event escalation action" field is set to User,
User Action is no longer dimmed. You can enter the name of a procedure
to be executed if the event displayed at the top of the page occurs. To
use this field, refer to the instructions in Section 7.5.2.
|
The "Event explanation and investigation hints" section of
the Event Customization page, which is not customizable, includes a
description of the event displayed and a suggestion for how to correct
any problems that the event signals.
7.5.2 Entering a User Action
Note
OpenVMS and Windows execute the User Action procedure somewhat
differently, as explained in the following paragraphs.
|
The following notes pertain to writing and executing User Action
commands or command procedures. These notes apply to User Actions on
both OpenVMS and Windows systems.
- The procedure that you specify as the User Action will be executed
in the following manner:
- It will be issued to the operating system that is running the
Availability Manager Data Analyzer.
- It will be issued as a process separate from the one running the
Availability Manager to avoid affecting its operation.
- It will be run under the same account as the one running the
Availability Manager Data Analyzer.
- User Actions are intended to execute procedures that do not require
interactive displays or user input.
- You can enter User Actions for events on either a systemwide basis
or a per-node basis:
- On a systemwide basis, the User Action is issued for an event that
occurs on any node.
- On a per-node basis, the User Action is issued for an event that
occurs only on a specific node.
- If event logging is enabled, the Availability Manager writes events
to the event log file (called AnalyzerEvents.log by default on OpenVMS
systems and AvailManEvents.log by default on Windows systems). A status
line matching the original line indicates whether the User Action was
successfully issued. For example:
AMGR/KOINE -- 13-Apr-2001 15:33:02.531 --<0,CFGDON>KOINE configuration done
AMGR/KOINE -- 13-Apr-2001 15:33:02.531 --<0,CFGDON>KOINE configuration done
(User Action issued for this event on the client O/S)
|
Other events might appear between the first logging and the status
line. The log file does not indicate whether the User Action
executed successfully. You must obtain the execution status from the
operating system, for example, the OpenVMS batch procedure log.
- The User Action functionality might be enhanced in a future release
of the Availability Manager, but backward compatibility is not
guaranteed for the format of User Action procedure strings or for the
method of executing the procedures on a particular operating system.
7.5.2.1 Executing a Procedure on an OpenVMS System
The User Action procedure and arguments are passed as string values to
the DCL command interpreter as follows:
$ SUBMIT/NOPRINTER/LOG user_action_procedure arg_1 arg_2 arg_3
arg_4
where:
- The first command is the DCL command SUBMIT with associated
qualifiers.
- user_action_procedure is a valid OpenVMS file name.
Enter the name of the procedure you want OpenVMS to execute using
the following format:
disk:[directory]filename.COM
where:
- disk is the name of the disk where the procedure resides.
- directory is the name of the directory where the procedure
resides.
- filename.COM is the file name of the command procedure you
want OpenVMS to execute. The file name must follow OpenVMS file-naming
conventions.
The file you submit must contain one or more DCL command statements
that form a valid OpenVMS command procedure.
- The arguments correspond to the following data:
| Argument |
Description |
|
arg_1
|
Node name of the node that generated the event.
|
|
arg_2
|
Date and time that the event was generated.
|
|
arg_3
|
Name of the event.
|
|
arg_4
|
Description of the event.
|
The Availability Manager does not interpret the string contents. You
can supply any content in the User Action procedure that DCL accepts in
the OpenVMS environment for the user account running the Data Analyzer.
However, if you include arguments in the User Action procedure, they
might displace or overwrite arguments supplied by the Availability
Manager.
A suitable batch queue must be available on the Data Analyzer computer
to be the target of the SUBMIT command. Refer to the OpenVMS DCL Dictionary for
the SUBMIT, INITIALIZE/QUEUE, and START/QUEUE commands for use of batch
queues and the queue manager.
The following is an example of a DCL command procedure:
$ if (p3.eqs."DSKOFF").and.(p1.eqs."PAYROL")
$ then
$   mail/subject="''p2' ''p3' ''p4' "urgent_instructions.txt
call_center,finance,adams
$ else
$   mail/subject="''p2' ''p3' ''p4' "instructions.txt call_center
$ endif
|
The pn numbers in the DCL procedure correspond in type,
number, and position to the arguments in the preceding table.
You might use a procedure like this one to notify several groups if the
payroll disk goes off line, or to notify the call center if any other
event occurs.
7.5.2.2 Executing a Procedure on a Windows System
The user action procedure and arguments are passed as string values to
the Windows command interpreter as follows:
"AT time CMD/C user_action_procedure arg_1 arg_2 arg_3
arg_4"
where:
- AT is the Windows command that schedules commands and programs at a
specified time and date.
- The time substring is a short period of time---
aproximately 2 minutes---in the future so that the AT utility processes
the user action procedure today rather than tomorrow. This is necessary
because the AT utility cannot execute a procedure "now"
rather than at an explicitly stated time.
- user_action_procedure is a Windows command or valid file
name. The file must contain one or more Windows command statements to
form a valid command procedure. (See the example in this section.)
Enter the name of the procedure you want Windows to execute using
the following format:
device:\(directory\filename.BAT
where:
- device is the disk on which the procedure is located.
- directory is the folder in which the procedure is located.
- filename.BAT is the name of the command file to be
executed. The file name must follow Windows file-naming conventions.
- The arguments are listed in the table in Section 7.5.2.1.
The Availability Manager does not interpret the string contents. You
can supply any content in the string that the Windows command-line
interpreter accepts for the user account running the Data Analyzer.
However, if you include arguments in the User Action procedure, they
might displace or overwrite arguments supplied by the Availability
Manager.
You cannot specify positional command-line switches or arguments to the
AT command, although you can include switches in the User Action
procedure substring as qualifiers to the user-supplied command. This is
a limitation of both the Windows command-line interpreter and the way
the entire string is passed from the Availability Manager to Windows.
The Schedule service must be running on the Data Analyzer computer in
order to use the AT command. However, the Schedule service does not run
by default. To start the Schedule service, refer to the Windows
documentation for instructions in the use of the CONTROL
PANEL/SERVICES/SCHEDULE/[startup button].
Windows Examples
The following are examples of a Windows command procedure and a direct
command invocation:
- Command procedure: notify.bat
net send/domain:openvms %1 %2 %3 %4
|
The numbers preceded by a percent sign (%) correspond to the
arguments in the table in Section 7.5.2.1.
- Direct command invocation
When executed, both of these User Actions display a message containing
the contents of the command-line arguments in the OpenVMS domain.
7.6 Customizing Security Features
The following sections explain how to change these security features:
- Data Analyzer passwords for OpenVMS and Windows Data Collector nodes
- OpenVMS Data Collector security triplets
- A Windows Data Collector password
Note
OpenVMS Data Collector nodes can have more than one password: each
password is part of a security triplet. (Windows nodes allow you to
have only one password per node.)
|
7.6.1 Changing Data Analyzer Passwords
You can change the passwords that the Windows Data Analyzer uses for
OpenVMS Data Collector nodes and for Windows Data Collector nodes. The
following sections explain how to perform both actions.
7.6.1.1 Changing a Data Analyzer Password for an OpenVMS Data Collector Node
When you click Customize OpenVMS... on the
Customize menu of the Application window, the
Availability Manager displays a Security page (Figure 7-13).
Figure 7-13 OpenVMS Security Customization Page

To change the default password for the Data Analyzer to use to access
OpenVMS Data Collector nodes, enter a password of exactly 8 uppercase
alphanumeric characters. The Availability Manager will use this password to
access OpenVMS Data Collector nodes. This password must match the
password that is part of the OpenVMS Data Collector security triplet
(see Section 1.4).
When you are satisfied with your password, click OK.
Exit the Availability Manager, and restart the application for the password to
take effect.
|
