HP OpenVMS Systems Documentation

Content starts here Availability Manager User's Guide

Availability Manager User's Guide

Order Number: AA-RNSJA-TE


April 2001

This guide explains how to use Availability Manager software to detect and correct system availability problems.

Revision/Update Information: This is a new manual.

Operating System: Data Analyzer: Windows NT 4.0, SP 3 or higher; Windows 2000;
OpenVMS Version 7.1 or later
Data Collector: OpenVMS Alpha and
VAX Version 6.2 or later

Software Version: Availability Manager Version 1.4

Compaq Computer Corporation
Houston, Texas


© 2001 Compaq Computer Corporation

Compaq, VAX, VMS, and the Compaq logo Registered in U.S. Patent and Trademark Office.

OpenVMS is a trademark of Compaq Information Technologies Group, L.P. in the United States and other countries.

Microsoft, Windows, Windows NT, and Windows 95 are trademarks of Microsoft Corporation in the United States and other countries.

Motif, OSF/1, and UNIX are trademarks of The Open Group in the United States and other countries.

All other product names mentioned herein may be the trademarks of their respective companies.

Confidential computer software. Valid license from Compaq required for possession, use, or copying. Consistent with FAR 12.211 and 12.212, Commercial Computer Software, Computer Software Documentation, and Technical Data for Commercial Items are licensed to the U.S. Government under vendor's standard commercial license.

Compaq shall not be liable for technical or editorial errors or omissions contained herein. The information in this document is provided "as is" without warranty of any kind and is subject to change without notice. The warranties for Compaq products are set forth in the express limited warranty statements accompanying such products. Nothing herein should be construed as constituting an additional warranty.

ZK6552

The Compaq OpenVMS documentation set is available on CD-ROM.

Contents Index


Preface

Intended Audience

This guide is intended for system managers who install and use Compaq Availability Manager software. It is assumed that the system managers who use this product are familiar with Windows terms and functions.

Document Structure

This guide contains the following chapters and appendixes:

  • Chapter 1 provides an overview of Availability Manager software, including security features.
  • Chapter 2 describes how to start the Availability Manager, use the main Application window, select a group of nodes and individual nodes, and use online help.
  • Chapter 3 describes how to select nodes and display node data.
  • Chapter 4 describes how to display and interpret events.
  • Chapter 5 describes how to take a variety of corrective actions, called fixes, to improve system availability.
  • Chapter 6 describes the tasks you can perform to filter, select, and customize the display of data
  • Appendix A contains a table of CPU process states, which are referred to in Section 3.2.2.4 and in Section 3.2.9.1.
  • Appendix B contains a table of OpenVMS and Windows NT events that can be displayed in the Events pane discussed in Chapter 4.
  • Appendix C describes the events that can be signaled for each type of OpenVMS data that is collected.

Related Documents

The following manuals provide additional information:

  • OpenVMS System Manager's Manual describes tasks for managing an OpenVMS system. It also describes installing a product with the POLYCENTER Software Installation utility.
  • OpenVMS System Management Utilities Reference Manual describes utilities you can use to manage an OpenVMS system.
  • OpenVMS Programming Concepts Manual explains OpenVMS lock management concepts.

For additional information about Compaq OpenVMS products and services, access the Compaq website at the following location:


http://www.openvms.compaq.com/

Reader's Comments

Compaq welcomes your comments on this manual. Please send comments to either of the following addresses:

Internet openvmsdoc@compaq.com
Mail Compaq Computer Corporation
OSSG Documentation Group, ZKO3-4/U08
110 Spit Brook Rd.
Nashua, NH 03062-2698

How to Order Additional Documentation

Use the following World Wide Web address to order additional documentation:

http://www.openvms.compaq.com/

If you need help deciding which documentation best meets your needs, call 800-282-6672.

Conventions

The following conventions are used in this guide:

Ctrl/ x A sequence such as Ctrl/ x indicates that you must hold down the key labeled Ctrl while you press another key or a pointing device button.
PF1 x A sequence such as PF1 x indicates that you must first press and release the key labeled PF1 and then press and release another key or a pointing device button.
[Return] In examples, a key name enclosed in a box indicates that you press a key on the keyboard.

In text, a key name is not enclosed in a box. In the HTML version of this document, this convention appears as brackets, rather than a box.

... Horizontal ellipsis points in examples indicate one of the following possibilities:
  • Additional optional arguments in a statement have been omitted.
  • The preceding item or items can be repeated one or more times.
  • Additional parameters, values, or other information can be entered.
.
.
.
Vertical ellipsis points indicate the omission of items from a code example or command format; the items are omitted because they are not important to the topic being discussed.
( ) In command format descriptions, parentheses indicate that you must enclose the options in parentheses if you choose more than one.
[ ] In command format descriptions, brackets indicate optional elements. You can choose one, none, or all of the options. (Brackets are not optional, however, in the syntax of a directory name in an OpenVMS file specification or in the syntax of a substring specification in an assignment statement.)
{ } In command format descriptions, braces indicate required elements; you must choose one of the options listed.
bold text This typeface represents the introduction of a new term. It also represents the name of an argument, an attribute, or a reason. In the HTML version of this Conventions table, this convention appears as italic text.
italic text Italic text indicates important information, complete titles of manuals, or variables. Variables include information that varies in system output (Internal error number), in command lines (/PRODUCER= name), and in command parameters in text (where dd represents the predefined code for the device type).
UPPERCASE TEXT Uppercase text indicates a command, the name of a routine, the name of a file, or the abbreviation for a system privilege.
Monospace type Monospace type indicates code examples and interactive screen displays.

In the C programming language, monospace type identifies the following elements: keywords, the names of independently compiled external functions and files, syntax summaries, and references to variables or identifiers introduced in an example.

numbers All numbers in text are assumed to be decimal unless otherwise noted. Nondecimal radixes---binary, octal, or hexadecimal---are explicitly indicated.


Chapter 1
Overview

This chapter provides the following information:

  • What the Availability Manager is
  • How the Availability Manager works
  • How the Availability Manager identifies possible performance problems
  • How the Availability Manager maintains security

1.1 What Is the Availability Manager?

The Availability Manager is a system management tool that allows you to monitor, from an OpenVMS node or a Windows NT node, one or more OpenVMS nodes on an extended local area network (LAN).

The Availability Manager helps system managers and analysts target a specific node or process for detailed analysis. This tool collects system and process data from multiple OpenVMS nodes simultaneously; it analyzes the data and uses a graphical user interface (GUI) to display the output.

An older version of the tool, DECamds, uses a Motif GUI to display information about OpenVMS nodes. The newer version, called the Availability Manager, uses a Java GUI to display information about OpenVMS nodes on an OpenVMS or a Windows NT node.

The main Application window of the Availability Manager is divided into three sections that display different types of information about the nodes you are monitoring. Based on its analysis of the data, the Availability Manager notifies you immediately if any node you are monitoring is experiencing a performance problem, especially one that affects the node's accessibility to users. At a glance, you can see whether a problem is a persistent one that warrants further investigation and correction. The Availability Manager also maintains an event log file, where it logs every event displayed in the main Application window. (See Section 1.3 for details.)

An important advantage of the Availability Manager is that it uses its own network protocol; unlike most performance monitors, it does not rely on TCP/IP or any other standard protocol. Therefore, even if a standard protocol is unavailable, the Availability Manager can continue to operate.

You can customize the Availability Manager to meet the requirements of your particular site. For example, you can change the severity levels of the events that are displayed and escalate their importance.

The Availability Manager helps improve OpenVMS system and OpenVMS Cluster availability by providing the following features:

Availability Alerts users to resource availability problems; provides capabilities to improve availability.
Centralized management Provides centralized management of remote nodes within an extended local area network (LAN).
Intuitive interface Provides an easy-to-learn and easy-to-use graphical user interface (GUI).
Correction capability Allows real-time intervention, including adjustment of node and process parameters, even when remote nodes are hung.
Customization Adjusts to site-specific requirements through a wide range of customization options.
Scalability Makes it easier to monitor multiple OpenVMS nodes.

1.2 How Does the Availability Manager Work?

The Availability Manager utilizes two types of nodes for monitoring OpenVMS systems:

  • One or more OpenVMS Data Collector nodes, which run the software that collects the data on the OpenVMS nodes being monitored.
  • An OpenVMS or a Windows NT Data Analyzer node, which contains the software that analyzes the data collected from the monitored OpenVMS nodes.

The Data Analyzer and Data Collector nodes communicate over an extended LAN using an IEEE 802.3 Extended Packet format protocol. Once a secure connection is established, the Data Analyzer instructs the Data Collector to gather specific system and process data.

Although you can run the Data Analyzer as a member of a monitored cluster, it is typically run on a system that is not a member of the cluster being monitored. You can have more than one Data Analyzer application executing in a LAN, but only one Data Analyzer at a time should be running on each system.

Figure 1-1 shows a possible configuration of Data Analyzer and Data Collector nodes.

Figure 1-1 Availability Manager Node Configuration
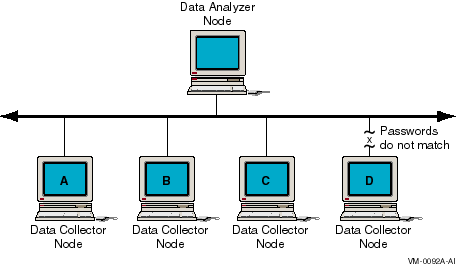

In Figure 1-1, the Data Analyzer can monitor nodes A, B, and C across the network. The password on node D does not match the password of the Data Analyzer; therefore, the Data Analyzer cannot monitor node D.

For information about password security, see Section 1.4.

Requesting and Receiving Information

After installing the Availability Manager software, you can begin to request information from one or more Data Collector nodes.

Requesting and receiving information requires the Availability Manager to perform a number of steps, which are shown in Figure 1-2 and explained after the figure.

Figure 1-2 Requesting and Receiving Information


The following steps correspond to the numbers in Figure 1-2.

  1. The GUI communicates users' requests for data to the driver on the Data Analyzer node.
  2. The Data Analyzer driver sends users' requests across the network to a driver on a Data Collector node.
  3. The Data Collector driver transmits the requested information over the network to the driver on the Data Analyzer node.
  4. The Data Analyzer driver passes the requested information to the GUI, which displays the data.

In step 4, the Availability Manager also checks the data for any events that should be signaled. The following section explains in more detail how data analysis and event detection work.

1.3 How Does the Availability Manager Identify Performance Problems?

When the Availability Manager detects problems on your system, it uses a combination of methods to bring these problems to the attention of the system manager. If no data display is open for a particular node, the Availability Manager reduces the data collection interval so that data can be analyzed more closely. Performance events are also signaled in the Events pane in the lower portion of the Application window (Figure 1-3).

Figure 1-3 Application Window


The following topics are related to detecting and signaling problems:

  • Collecting and analyzing data
  • Signaling events

1.3.1 Collecting and Analyzing Data

This section explains how the Availability Manager collects and analyzes data. It also defines terms related to data collection and analysis.

1.3.1.1 Types of Data Collection

You can use the Availability Manager to collect data either as a background activity or as a foreground activity.

  • Background data collection
    When you enable background collection of a specific type of data on a specific node, the Availability Manager collects that data whether or not any windows are currently displaying data for that node.
    To enable background data collection, select the check box for a specific type of data on a Data Collection page (Figure 1-4). (If the Customize window is for all OpenVMS nodes, you set defaults for all nodes. If the window is for one node, you set collection properties for a single node.)
    Chapter 6 contains instructions for customizing data collection properties.

    Figure 1-4 Data Collection Page


    By default, node summary data is always collected.
  • Foreground data collection
    Foreground data collection occurs automatically when you open any data page for a specific node. To open a node data page, double-click a node name in the Node pane of the Application window (Figure 1-3). The Node Summary page is displayed by default, and you can select tabs to display other data pages for that node. Figure 1-5 is an example of a Node Summary page.

    Figure 1-5 Sample Node Summary Page


    Foreground data collection for all data types begins automatically when any node data page is displayed. Data collection ends when all node data pages have been closed.
    Chapter 3 contains instructions for selecting nodes and displaying node data.

1.3.1.2 Events and Data Collection

An event is a problem or potential problem associated with resource availability. Users can customize criteria for events. Events are associated with types of data collected. For example, collection of CPU data is associated with the PRCCUR, PRCMWT, and PRCPWT events. (Appendix B describes events, and Appendix C describes the events that each type of data collection can signal.)

As data is collected, the Availability Manager evaluates it and signals an event whenever the data meets the user-specified criteria. These criteria are called thresholds and occurrences and are explained in Section 1.3.1.3.

Customization features are explained in detail in Chapter 6.

1.3.1.3 Data Collection Intervals

Data collection intervals, which are displayed on the Data Collection page (Figure 1-4), specify the frequency of data collection.

Table 1-1 describes each interval.

Table 1-1 Data Collection Intervals
Interval (in seconds) Description
Display How often data should be collected as a foreground activity.
Event How often data should be collected as a background activity if any events have been posted for that type of data.
NoEvent How often data should be collected as a background activity if no events have been posted for that type of data.

The following list indicates how the Availability Manager determines which collection interval to use for a particular type of data:

  • The Availability Manager starts background data collection at the NoEvent interval (for example, every 75 seconds). If no events have been posted for that type of data, the Availability Manager starts a new collection cycle every 75 seconds.
  • If events have been posted for that type of data, the Availability Manager starts a new collection cycle at the Event interval. This rate of data collection continues until all events for that type of data have been removed.
  • If there is a page open for a specific node, the Availability Manager starts a new collection cycle at the Display interval. This rate of data collection is used until the display is closed.

1.3.2 Posting Events

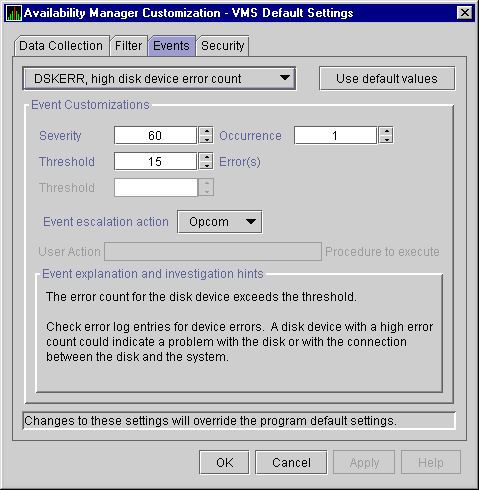
The Availability Manager posts events when data values exceed user-defined thresholds and occurrences. Threshold and occurrence values are displayed on event customization pages similar to the one shown in Figure 1-6.

Figure 1-6 Sample Event Customization Page

1.3.2.1 Thresholds and Occurrences

The Availability Manager uses the threshold value as a criterion for posting an event. In many cases, if a condition exceeds that value, the Availability Manager displays a message in the Events pane of the Application window (see Figure 1-3). Some thresholds are used in more complex tests.

An occurrence (or trigger) for a specific event is the number of consecutive data collections that must exceed the event threshold before the Availability Manager signals the event in the Events pane of the Application window and logs it in the Event Log file.

For example, the disk status data that the Availability Manager collects includes the error count on a disk. If you select the Disk Status check box on the Data Collection page (Figure 1-4) and the error count exceeds the threshold value of 15 on the Event Customization page (Figure 1-6) for more than one data collection, an event is posted.

Chapter 6 explains how users can change default values for event thresholds and occurrences.

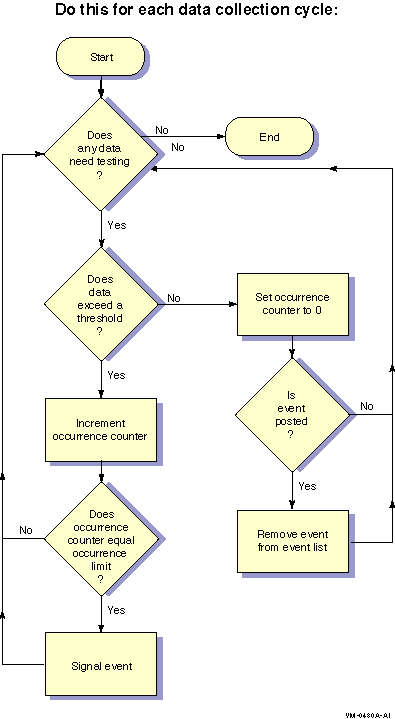
The Availability Manager evaluates every data collection for events. Any time a data value in a data collection exceeds a threshold, an occurrence counter is incremented. Whenever the occurrence count matches the Occurrence value on the Event Customization page (Figure 1-6), the event is signaled.

If, at any time during data collection, the data does not exceed the threshold, the occurrence counter is set to 0, and the event is removed from the Events pane. Figure 1-7 depicts this sequence.

Figure 1-7 Flow Chart of Event Testing


Next Contents Index